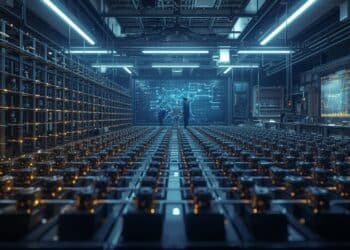











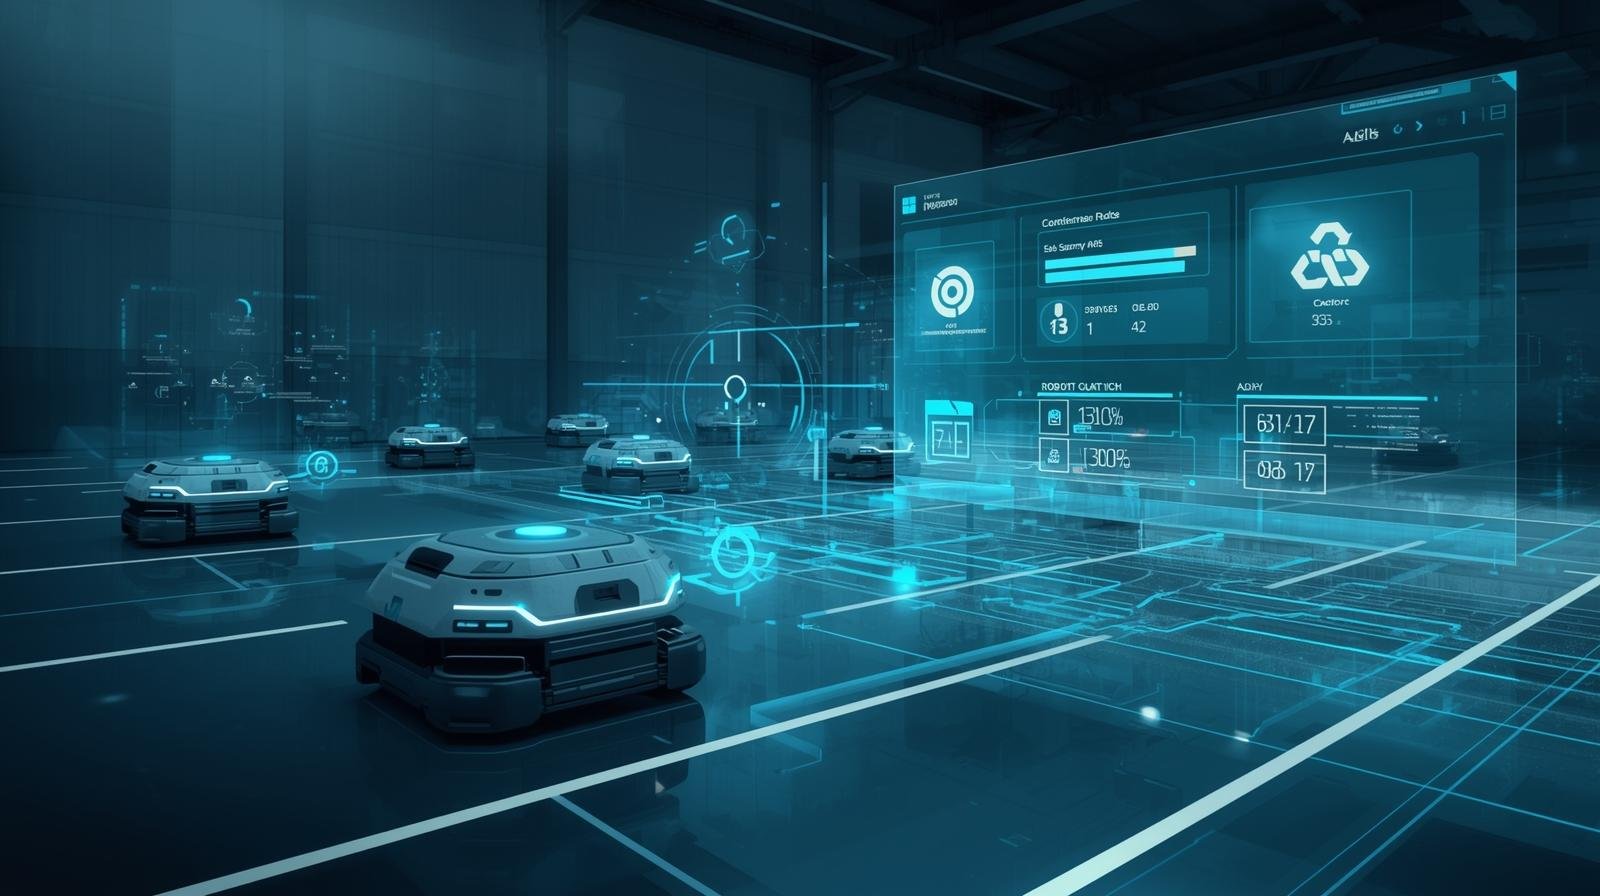
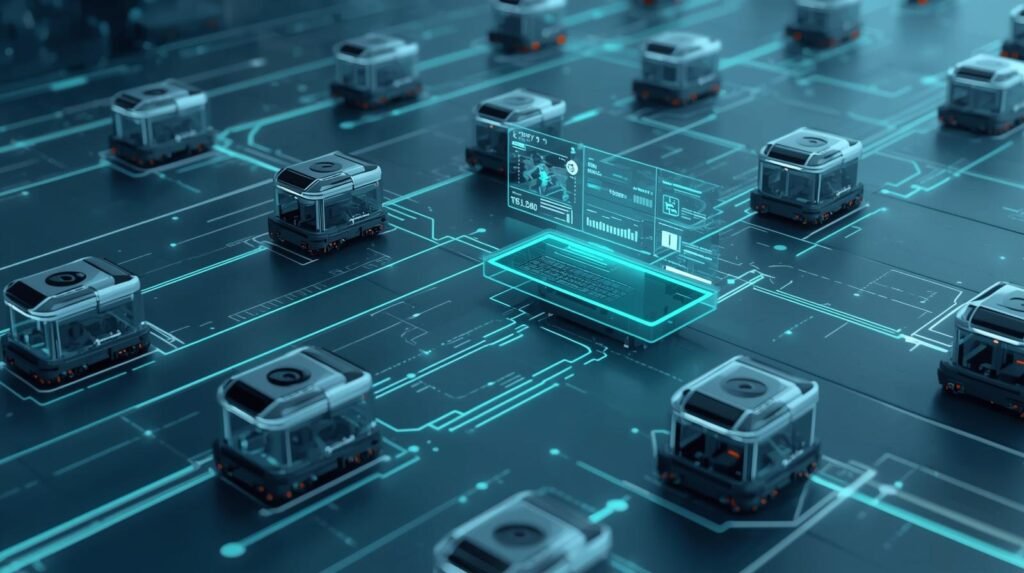
Use machine learning, data analysis, and automation to continually assess, improve, and defend your network in real time. AI-native networks are a whole new class of network systems that are based on AI rather than simply enabled by it. AI-native networks are intelligent, adaptive, and autonomous. The idea behind AI-native networks is to use machine learning, data analysis, and automation to continually assess, improve, and defend your network in real time.
The fundamental difference between AI-native networks and legacy networks lies in how they handle data. Legacy networks depend on large volumes of predefined rules and manual configuration. On the other hand, AI-native networks can analyze vast amounts of data generated by all devices, apps, and users accessing the network. As a result, AI-native networks can discover trends, recognize potential problems before they occur, and make decisions autonomously.
AI-native networks can identify abnormal traffic flows, detect and mitigate security risks, and dynamically route data to ensure optimal performance and availability. Because AI-native networks can dynamically adjust resources, bandwidth, and routes based on changing demands, they offer high efficiency and scalability and can easily adapt to rapidly evolving, increasingly complex networks such as 5G, Cloud Computing, and IoT.
AI-native networks also provide enhanced security. AI-native networks continually learn from normal network behavior and can quickly identify abnormalities and respond to security threats. Proactive detection and response enable organizations to better protect their critical business assets and comply with regulations.
With many companies undergoing digital transformations, AI-native networks are becoming a necessity for managing increasingly complex digital infrastructures. Not only do AI-native networks save organizations money on operational expenses, but they also enable faster innovation and improved customer experiences. Over the next few years, AI-native networks are expected to significantly impact how we think about connectivity.
#Robot Simulation Software – Smart Essential Explanation for Robotics
The following is a 5-step guide to managing a robotic fleet. In this guide, we will explain the process from finding your robots on a map to developing a complete operation over time, and from what can be chaotic to efficient, clockwork operations.
Summary
“Robot Fleet Management: A smart guide to operating multiple robots using one central ‘Control Tower’ to manage tasks, similar to an Air Traffic Controller.”
In the following article, the process of effectively using a central “control tower” to manage multiple robots simultaneously (similar to an air traffic controller) is broken down into five easy-to-follow steps.
Step 1 — A Single View of All Robots:
The first step is to have an integrated view of all robots.
A single dashboard provides real-time information about each robot’s location, status, and any issues that may exist.
Step 2 — Automated Job Assignment:
The second step is to automate the assignment of jobs to robots. In this example, when a new job comes up, it is automatically assigned to the first robot capable of performing it. The decision on who gets the job is based on several factors, including, but not limited to, the distance from the job site to the robot, the amount of work already queued for the robot, and the charge level of the robot’s batteries. Humans provide the job’s objectives, and the automation system provides the method for the job.
Step 3 — Traffic Rules to Prevent Robot Congestion:
In the third step, traffic rules are defined to prevent congestion among robots. This includes developing digital “traffic” rules of the road for robots. For example, you could have one-way lanes, define a right-of-way, or require robots to yield to other robots.
Step 4 — Maintenance:
The fourth step is to develop processes to keep the fleet healthy. This would include having the ability to automatically charge the robots and to predictively maintain them. It would also include using tools to monitor and diagnose the robots, identifying potential wear and tear before they break down.
Step 5 — Data Analysis:
The fifth step is to translate operational data into opportunities for improvement. For example, you could use analytical tools (e.g., heat maps) to identify bottlenecks, determine whether there are better ways to lay out your warehouse, improve routing options, and make informed decisions about scaling.
Robot Fleet Management
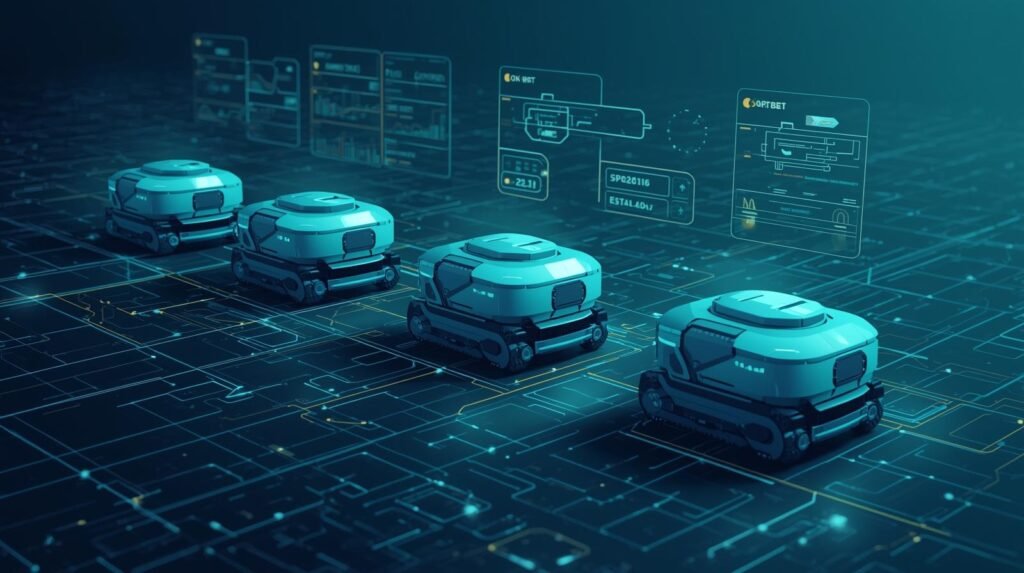
Robot Fleet Management is the integration of all aspects of managing multiple robots (e.g., AMRs, AGVs, drones) to ensure safe, efficient, and coordinated group operations. Robots operate independently and use management software to communicate with each other so that they can be assigned work, have their status monitored, and move freely within an area.
The most important aspect of a Robot Fleet Management System is Dispatching (i.e., assigning work to a specific robot at a specific time along a pre-defined path). When done correctly, Dispatching reduces idle time, eliminates bottlenecks, and helps meet Service Level Agreements (SLAs). A good fleet management system should also support “mixed fleets,” where multiple robot brands/models are used from the same location.
Another key function of a Robot Fleet Management System is Navigation/Traffic Control. The rules regarding how robots pass each other, yield to each other, and/or reroute around obstacles or when people are using the same area as the robots must be programmed into the fleet management system. Examples of this include setting a maximum speed limit for each lane, specifying one-way travel in some areas, designating “no-go” areas, and dynamically adjusting a robot’s route to minimize traffic congestion in the surrounding area.
#Digital Twin for Robots – Smart Essential Guide in 5 Steps
Maintenance and monitoring are improved by tracking maintenance activities and robot performance using Robot Fleet Management. The system tracks battery levels, charging schedules, motor temperatures, errors, and robot usage. As such, a team can move from reactive problem-solving to proactive maintenance, thereby reducing downtime and extending hardware life.
With data and reporting, Robot Fleet Management turns operational decisions into measurable results. Performance metrics include: hourly task completion, average mission time, wait times at pick-up and drop-off points, near-miss alerts, and charge cycle efficiency. These metrics enable managers to modify workflow designs, relocate staging areas, and add robots only when throughput increases.
Robot Fleet Management also provides an additional layer of security and supports connectivity with WMS, MES, and ERP systems, allowing robots to automatically receive work orders based on their type. Additionally, role-based access control, audit logs, and encryption of all communication help protect against unauthorized access to operational data and/or unsafe changes.
When considering solutions to manage robot fleets, you should consider the following three aspects: (1) how Robot Fleet Management handles peak traffic and failure scenarios; (2) how easily Robot Fleet Management can be integrated with your current software and maps; and (3) how Robot Fleet Management support/enforce safety standards in shared operating spaces between humans and robots. When implemented properly, Robot Fleet Management provides consistent, scalable, and straightforward operations on a daily basis.
Example on Warehouse:
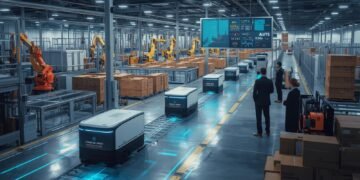
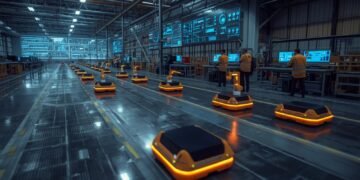
A fleet of 60 Autonomous Mobile Robots (AMRS), that transport totes from Pick Stations to Packing Lines within a Fulfillment Warehouse are supervised by a Fleet Manager. The Robot Fleet Management System assigns Jobs to AMRS utilizing factors such as Battery Level, Distance, Aisle Congestion, and Pick Priority. When a Forklift obstructs an aisle, the manager initiates Zone Closure; the Robots route around the blockage, and the transport totes from Pick Stations to Packing Lines within a fulfillment warehouse so that Pack Stations continue to be supplied with totes.
During Peak Hours, the System enforces Traffic Rules at intersections, prevents bottlenecks, schedules task reassignments, and places Idle Robots in Staging Areas. Reports generated during each shift provide data regarding Utilization, Wait Times, and Charging Compliance. Data is used for Continuous Improvement and provides Supervisors with Exceptions to quickly address.
From Chaos to Clockwork: How a Smart System Creates a Team
You previously viewed a robot as an independent unit—a smart machine with its own capabilities. Today, you can see the entire orchestra of robots working together. True robot fleet management genius doesn’t come from a checklist but from an ongoing cycle of monitoring your robots, directing their activities, improving their workflow, keeping them healthy, and learning from the data that you collect. As you complete each task in this cycle, you build an increasingly intelligent process.
This cycle allows you to transition a collection of machines into a single cohesive workforce. The most significant advantage of centrally controlling all robots is the ability to transform uncoordinated equipment into a single, highly coordinated workforce. At first, you will notice chaos, then you will see the system’s intelligent aspect at work, ensuring processes run on time and enabling maximum efficiency across the combined efforts of multiple robots.
Robot Fleet Management isn’t limited to large industrial operations. When you see a delivery robot traveling down a sidewalk, a cleaning robot roaming through a hospital, or a grocery cart being pulled by an automated cart, you’ll have a greater appreciation for the “brains” behind the operation. Your new way of seeing will also help you understand how this technology is creating an increasingly more efficient world — one intelligent fleet at a time.
Before vs After Robot Fleet Management
| Aspect | Without Fleet Mangement | With Fleet Management |
|---|---|---|
| Coordination | Robots work independently | Centralized coordination |
| Efficiency | Low (idle time) | High utilization |
| Errors | Frequent collisions | Optimized routing |
| Monitoring | Limited visibility | Real-time tracking |
| Scalability | Difficult | Easily scalable |
Example: Warehouses using fleet management systems improve efficiency by up to 30-40%
Source: Deloitte Robotics & Automation
https://www2.deloitte.com
Robot Fleet Management Software: Centralized software to monitor and control robot fleets.
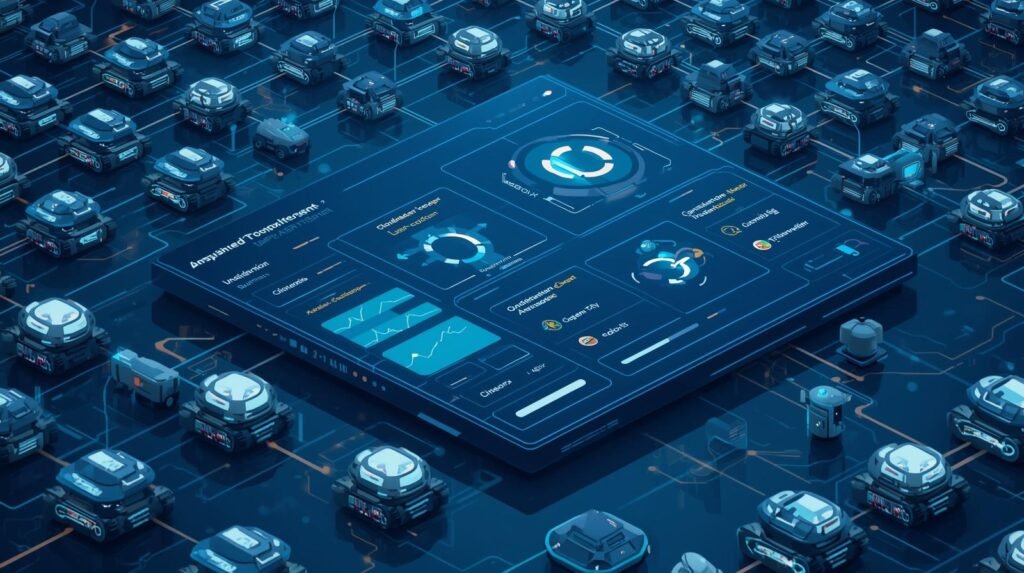
Fleet management systems for robots (robot fleets) are centralized, computer-based systems that allow teams to monitor, manage, and regulate a group of robots using one interface. This could be autonomous mobile robots in a warehouse, delivery robots in a hospital, or inspection robots in a manufacturing facility. A primary difference from the traditional method of monitoring/controlling all individual robots is that a fleet management system provides a single point of contact for users to view each robot’s status and location, confirm whether the task has been completed, and receive alert notifications.
One of the key functions of a fleet management system for robots is to automatically assign work to an assigned robot. The system will use information about the robot’s proximity to the task to be performed, its remaining battery life, capabilities, and priority to automatically select the best robot to perform the task. The benefits of this automation include reduced downtime when a robot is unavailable, no duplication of tasks assigned to multiple robots, and increased productivity during peak periods of operation.
#Hybrid Cloud Edge Robotics – Smart Essential Guide
In addition to automatic assignment of jobs, many of today’s systems also offer scheduling strategies (i.e., the highest priority work is assigned to a work center/robot next) and exception handling (if a robot cannot access a corridor because it has been blocked by something else for example, then the system will automatically send that job to another robot).
Additionally, real-time supervision, route optimization, and coordination are common features in most robotic fleet management systems. The common types of traffic control that can be managed through a robotic fleet management system include: route planning; geofencing; speed limits; right-of-way rules; safe stop behaviors; etc. These functions can help coordinate traffic flow when multiple robots operate in the same space. Additionally, robotic fleet management systems can dynamically adapt the robots’ routing plan in response to changing working-environment conditions (e.g., when an aisle closes or a temporary obstacle blocks a path).
Robot fleet management software platforms that operate effectively will increase uptime for your robot fleet. They do this by monitoring the condition of your robot fleet. Therefore, the platform tracks and monitors various metrics, including battery trending and charge behavior, fault codes, communication with the robots, usage, etc. The information tracked will notify you of potential problems before they become significant. Maintenance can transition from reactive repair of failed robots to planned service on your robots. This will help extend the life of each robot and minimize unplanned downtime.
The importance of Robot Fleet Management Software spans Data and Integration. Operational Analytics (e.g., Missions Per Hour, Average Travel Time, Queue Time, Failure Rate, etc.) will give you a clear understanding of where your bottlenecks are and how to fix them. Another major consideration is integrating this application with your WMS, MES, and ERP systems so that your robots can receive automated Work Orders. Finally, role-based access and audit logging will allow you to control who has permission to modify your Map(s), Mission(s), Safety Parameters, etc.
When evaluating Robot Fleet Management Software, assess its Scalability: does it support multiple brands/types of Robots? Is the software Reliable during network interruptions? How Easy is it to understand/monitor, and Report on the Robots? Ideally, Robot Fleet Management Software should make Multi-Robot Operations Easier, Provide Safe Operating Environments for the robots, and Allow You to Continually Optimize Your Robots.
Examples related to Airport
Airport personnel deploy cleaning robots across airports’ terminal buildings, restroom areas, and gate locations. Fleet management for the airport’s cleaning robots is provided by software that displays each robot on a map, along with its current location, the active route (or mission), sensor health, and remaining consumables. In addition, supervisors can use the system to create cleaning missions based on specific time windows, geographically restricted “no-go” zones, and performance levels (service levels) that are tied to flight schedules.
A robot will immediately upload a notification with images if it detects a spill in its area; this notification will include a request for human assistance and will prevent other nearby robots from operating to avoid spreading the spill. Additionally, the software automatically determines when a refill should be scheduled and then schedules it. At night, the software also performs over-the-air updates to all applicable robots. Finally, the software creates audit logs and generates billing information for vendors based on the number of hours the contractor was permitted to operate by role-based access.
What Fleet Management Software Actually Controls
| Control Area | Assigns jobs to robots | Ricking items in the warehouse |
|---|---|---|
| Navigation control | Optimizes routes | Avoid congestion |
| Monitoring | Tracks robot status | Battery, performance |
| Task assignment | Assigns jobs to robots | Picking items in warehouse |
| Maintenance alerts | Predicts failures | Schedule repairs |
| Integration | Connects multiple robot bands | Unified dashboard |
Example: Modern systems can manage hundreds of robots through a single interface.
Source: Amazon Robotics Overview.
https://www.aboutamazon.com/news/operations/amazon-robotics
The Big Question: What If My Robots Are from Different Brands?
As you think about it, theoretically, having an entire fleet of robots from the same vendor — all able to talk to each other — makes management easy. Real-world business issues make it unlikely that a company would purchase all of its robots from the same vendor, as vendors are likely to supply robots that operate in different ways, requiring greater management complexity than previously experienced.
For instance, Company A supplies a number of robots to move products off shelves. The company has to go out and find Company B, which supplies robots to pack products. Now the company has a number of different types of robots, which equates to a significant amount of work to do — how to manage all of those robots from a single screen. Managing your Apple Watch to communicate seamlessly with your Google phone is exactly the same problem. These were designed to communicate in the same way.
The capability of different types of robots to communicate in the same operating environment is referred to as “interoperability.” As the robotics industry continues to grow, many vendors continue to manufacture a variety of products. Many vendors supply proprietary software to control their products, thus isolating “islands” of technology. Therefore, without a “bridge” to connect these systems, you will have to run each brand’s robots separately from a single platform.
One of the greatest advantages of superior robotic fleets over the average is the ability to integrate multiple systems and/or brands into a single platform. Fortunately, the robotics community is working toward solving the issue of robotic fleet interoperability. For example, in terms of computer hardware, technology has created a common standard in the form of USB ports; whether you have a Dell laptop, HP mouse, or Apple keyboard, they all work together.
The key to the robotic “universal translator” is the growing adoption of these new interoperability standards by both commercial and open-source developers to manage their respective robotic fleets. As such, anyone currently evaluating this type of technology should be asking all potential software vendors about their strategy for achieving interoperability. This will allow for a single dashboard to manage a wide variety of multi-brands as if it were all part of the same fleet.
Step 1: Get a Bird’s-Eye View—See Your Entire Fleet on One Screen
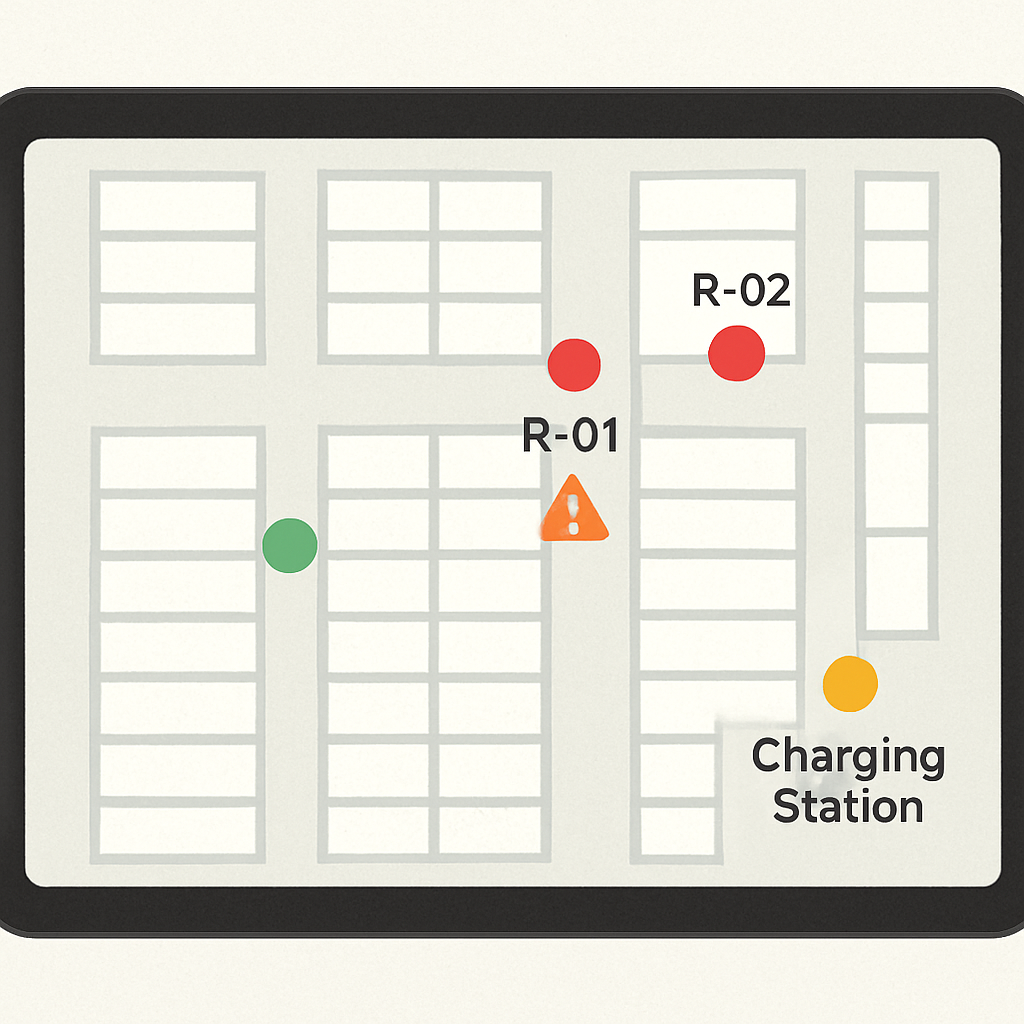
Total visibility via a centralized dashboard is the first step in managing a robot fleet; it shows a map of where each of your robots is located and what they are doing. This will give you a way to visually organize potentially chaotic processes, allowing you to see what is happening immediately. Without having a complete view of your operation, sending intelligent orders to your robots is basically impossible. Each of your robots’ movements will be displayed as an icon on your facility map, and the status of each of your robots will be updated in real time by the dashboard, so that you will get immediate answers to key questions.
Is Robot-01 currently holding a shelf? If Robot-01 is holding a shelf, the Robot-01 icon may appear green and move. Are there issues with Robot-02’s battery level? If so, Robot-02’s icon may turn yellow as the robot approaches a charging station. Has a robot encountered an issue or obstacle? If yes, the Robot-01 icon turns red, indicating to the human operator that they need to assist the robot.
Being able to see your entire robot fleet at once lets you shift from guessing what might happen to seeing what is happening. It enables you to move from being unaware of how your robot fleet is operating to taking action based on the data available to you.
The visibility of your robot fleet does not stop at simply monitoring its performance. The visibility of your robot fleet is the first step toward gaining control over it. Once you have visibility of each of your robots and where they are located, you can then instruct them.
Fleet Tracking Technology: Real-Time Visibility into Robot Locations and Performance
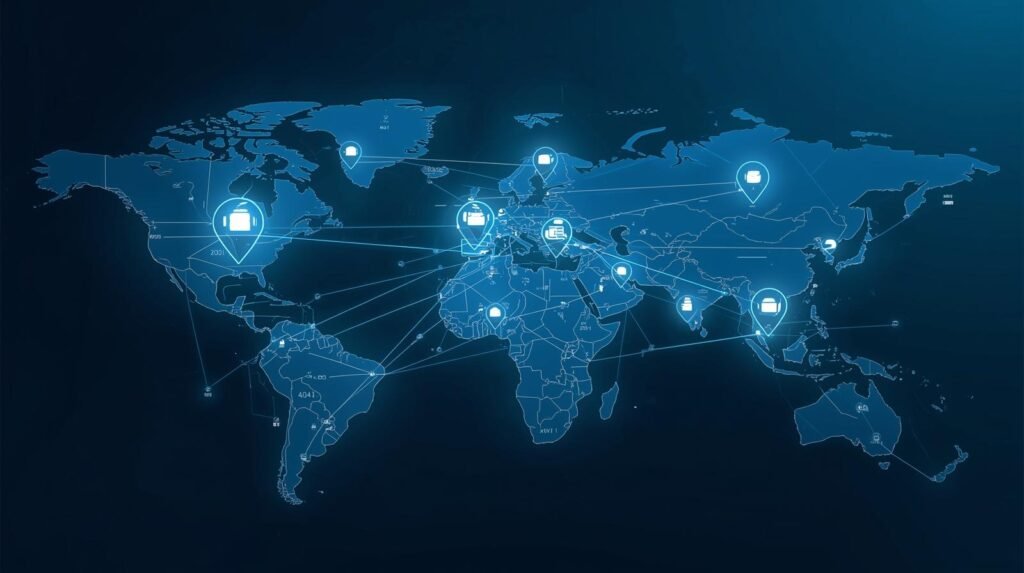
Fleet tracking technology provides real-time information on robot location, activities, and performance across all your operational areas. Managers who need to manage large groups of robots in their warehouse, hospital, factory, or campus environment can use fleet-tracking technology to know where their robots are and what they are doing, rather than just guessing. With fleet tracking technology integrated into your robot fleet management software, managers can see, in a single map-based view, the current locations of robots, current job assignments, downtime, and exceptions.
#Revolutionary Cloud Robotics Explained for Everyone
In essence, Fleet Tracking Technology collects telemetry data (e.g., position, speed, battery life, connectivity, job status, error codes) and translates it into dashboards and alerting systems. In Robot Fleet Management, tracking enables rapid identification of congested areas, blocked paths, missed handoffs at pick-up/drop-off locations, and lost robots that cannot find their target. Geofencing also allows organizations to enforce compliance with designated prohibited zones, one-way aisles, and safe buffers surrounding individuals and equipment.
The second advantage of utilizing Fleet Tracking Technology in Robot Fleet Management is the ability to track an organization’s fleet performance. Organizations can use Fleet Tracking Technology to collect the following metrics: utilization per robot; number of missions completed per hour; average time to complete a mission; wait times; and charge-cycle efficiency. Through these metrics, organizations can answer key operational questions related to Robot Fleet Management reviews:
1) Is the staging area limiting the number of robots available to complete tasks?
2) Are routes being utilized efficiently, or are tasks being released too early/late?
3) Should speed limits be reduced, or should passing zones be implemented, and/or should task batching be adjusted?
Improvements made based on data collected from Fleet Tracking Technology are substantiated by objective evidence rather than anecdotal information.
Robot Fleet Management utilizes Fleet Tracking Technology to help improve reliability/maintenance, and fleet management. By using the robot fleet to track various metrics, including battery health, motor temperature, faults per hour/week/month, network dropouts, and many other metrics, Fleet Tracking Technology allows teams to identify trend patterns in areas where a potential failure may occur before a failure happens, which enables teams to plan predictive maintenance to prevent unplanned downtime. The steady flow of product and reduced disruptions during peak production times are also direct results of using Robot Fleet Management via Fleet Tracking Technology.
Lastly, Fleet Tracking Technology supports accountability and integration. The time-stamped logs created provide an audit trail (date/time and location) of events for historical reference and continuous process improvement. When Fleet Tracking Technology is used in conjunction with Robot Fleet Management and upper-level systems (WMS/MES), it provides confidence that tasks are being properly assigned to the proper resource, that robots are being utilized at their maximum capacity, and that performance is transparent, as the fleet size grows.
Example related to City Pilot
A city pilot is using autonomous robots that will be on sidewalks delivering food from restaurants to students in dorms. The fleet tracking system utilizes a combination of three technologies (GPS, Visual Odometry, and Cellular Telemetry) to send real-time data regarding the robot’s location, speed, and incidents to operational staff. Operations staff can view a map with heat maps showing areas where slowdowns (slow zones), Curb Ramp Issues, or pedestrian conflicts have occurred.
The Platform will predict when the Robot will arrive and automatically assign meal handoffs for delivery to safe drop-off locations. If the Weather affects the sensors, the Robots can switch to Reduced Speed Mode and take well-lit routes. At the end of each day, the Analytics compares Planned vs Actual routes to Optimize Geofences, Staffing, and Battery Swap Locations. Operational managers can adjust Optimization Rules to reduce Empty Travel Time and Wait Time.
Real – Time Fleet Tracking Metrics
| Metric | What it Measures | Why it Matters |
|---|---|---|
| Location tracking | Robot position in real time | Prevent collisions |
| Task completion rate | Tasks finished per hour | Measure Productivity |
| Battery level | Energy status | Avoid downtime |
| Utilization rate | Active vs idle time | Optimize efficiency |
| Utilization rate | System faults | Improve reliability |
Statistic: Real-time tracking can improve fleet productivity by up to 25%
Source: McKinsey Automation Insights
https://www.mckinsey.com
Step 2: Be the Director—How the System Assigns Work So You Don’t Have To
Now that you can see where your team is on a map, it is time to start making them work. Just like there is no reason to micro-manage every single robot, as the director of the system, you will provide a high-level direction, or mission, to the system, such as “Get all the items required for the 20 online orders”. At that point, the system will understand what must be accomplished and utilize its smart fleet management capability to determine which robot(s), if more than one, should accomplish the tasks and how (i.e., the route they will take).
This section introduces another key term, task allocation. Task allocation is very much the same as utilizing today’s modern dispatchers for a food delivery company. When you make an order, the system does not send a message to each driver in the city. The system immediately determines which driver is the closest, and/or available, and assigns that driver the job. In much the same way, robot management systems evaluate which robot can complete a task most efficiently based on the robots’ locations, battery levels, and current workloads.
It is the automation of this process that will provide the means for improving the efficiency of an entire robot fleet. While a human can allocate the tasks of a few robots, it would be impossible to do so with a large number of robots. Smart systems can also quickly (in milliseconds) optimize task allocation for a group of robots and ensure all robots are working at all times, not idling while a task waits. In addition to removing the logistics of assigning tasks to a large number of robots, these systems will enable your fleet to work together as one highly efficient, well-coordinated team.
You will be able to transition from being a firefighter to a strategic planner. The system will determine which tasks to assign to your robots, and they will move with a sense of purpose. However, this sense of purpose brings with it the next challenge — traffic management.
Fleet Automation: Automate task assignment and robot coordination
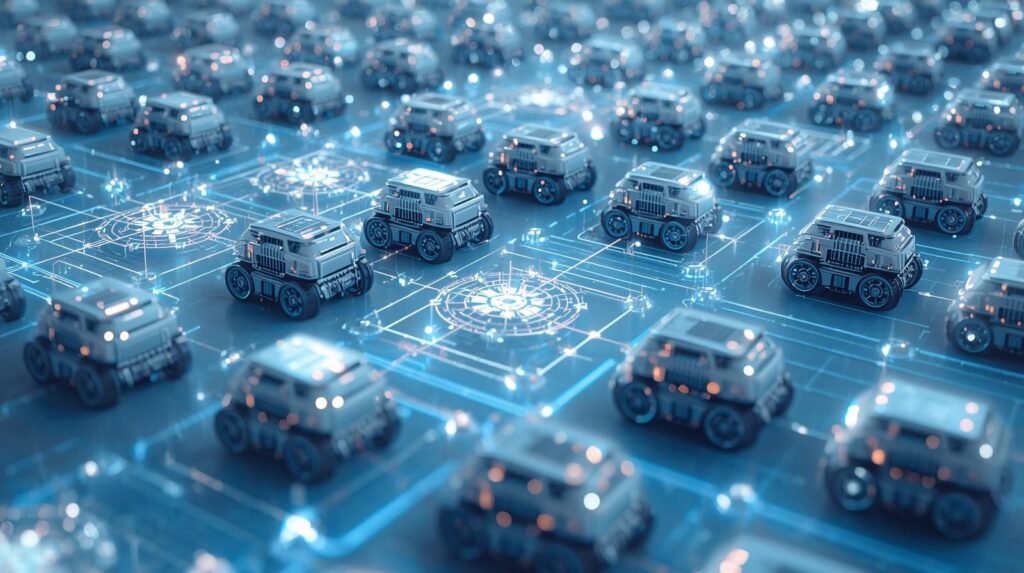
Fleet automation uses software and business rules to automate the assignment of work to robots, navigation, and the overall operation of a facility. This process is done with minimum operator input. In contrast to manual processes for assigning individual robots to specific jobs, fleet automation uses algorithms to continuously monitor service demand, available robots, and the facility’s operating conditions, enabling rapid and consistent decisions. When combined with robot fleet management, a number of robots can be used as a coordinated workforce.
The most significant advantages of using fleet automation are its ability to automatically assign tasks. Fleet automation determines which robot is best suited to complete the task based on attributes such as proximity to the task location (pickup point), battery condition, payload capacity, the type of sensors it is equipped with, and the task’s priority. Robot fleet management leverages these capabilities to minimize each robot’s idle time, reduce duplication of effort, and ensure compliance with service-level agreements as task volume increases. In addition to workload and task assignments, coordination and traffic control are also important.
Fleet automation provides the necessary functions to govern right-of-way rules, dynamic routing, speed limits, and safe stopping in areas where multiple robots share space. An example of how fleet automation works is that if an aisle is blocked or a robot fails, it can reassign the task(s) to the failed or blocked robot and dynamically route adjacent robots to avoid congestion.
1. In addition to improving the efficiency of fleets, Fleet Automation will assist with the planning and allocation of robot charging resources.
2. The robots can be scheduled to charge during periods of low demand.
3. Robots can rotate through chargers and thus eliminate waiting times in lines.
4. Charging occurs in a staging area, which eliminates deadhead travel.
5. The automatic charging of robots in Robot Fleet Management ensures that robots remain available and prevents unplanned reduction in capacity from depleted batteries.
6. Another advantage of Fleet Automation is that it generates operational intelligence.
7. Data provided by Fleet Automation includes cycle time, queue time, travel distance, mission success rates, and what causes exceptions.
8. The Robot Fleet Management Team can use this data to adjust the dispatching rules, adjust the warehouse layout, and see if additional robots improve production or just create congestion.
9. It is recommended that when you successfully implement Fleet Automation, you begin by establishing clear business rules, safe exception handling, and integration with systems that produce work (Warehouse Management Systems (WMS), Manufacturing Execution Systems (MES)).
10. Successful implementation of Fleet Automation results in reduced manual coordination, predictable results, and the ability to scale the Robot Fleet Management from a small pilot to a large-scale, multi-zone operation.
Step 3: Set the Rules of the Road—How to Prevent Robotic Traffic Jams
Fleet managers may face challenges as robots complete work orders and navigate a warehouse. A smart system that sets the rules is likely needed to keep problems from arising as robots do their jobs. If a smart system does not create the rules for robots, then the warehouse floor will resemble a highway with no traffic lights or speed limits. The manager is moving from just assigning tasks to coordinating the warehouse’s flow. A traffic jam of robots becomes an organized dance of robots working together.
Once digital traffic laws are created by the system’s intelligent component, the system will continue to optimize its assignment of robots to tasks. Rather than always using the closest available robot for a job, the system will apply rule-based logic to give common sense across the robot fleet. Examples of the types of rules that can be programmed include:
- The flow of narrow-aisle traffic is one-way to prevent collisions when robots travel in opposite directions.
- The robots designated to carry time-sensitive (high-priority) orders have the right-of-way, as if they were emergency vehicles, and are given priority by the system.
- Operational robots will give the right-of-way to robots running low on battery, and those robots will terminate their route at the nearest charging station.
You establish the above rules to direct an orchestra. Each machine knows exactly what it’s supposed to do and how to interact with the others as they perform the same functions. An important element of improving the efficiency of multiple robots is coordination. This reduces delays caused by the movement of goods and equipment.
Fleet Optimization: Optimize routes, workloads, and robot utilization
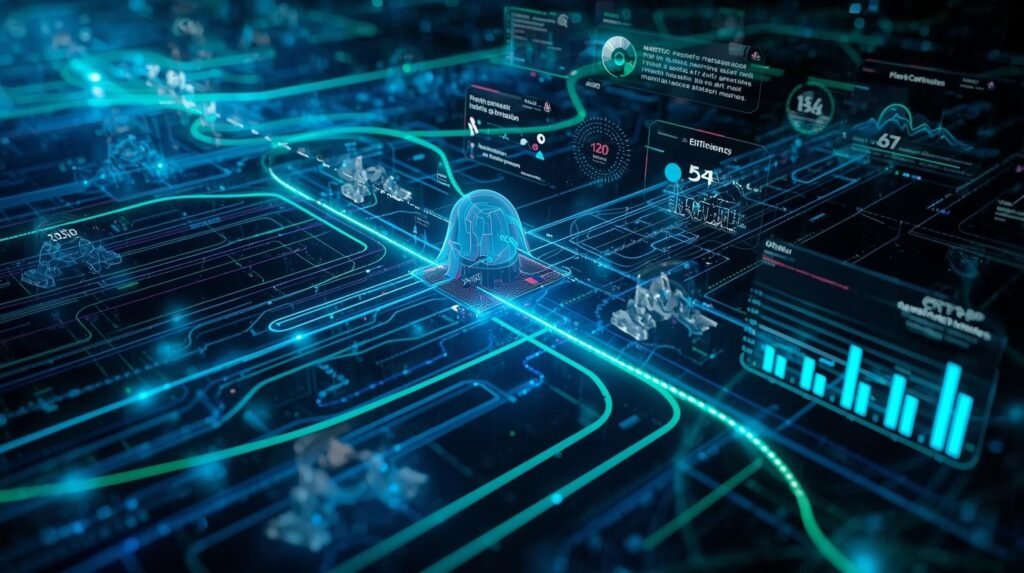
An optimized fleet of robots maximizes the effective use of each robot at every moment with regard to safety and predictable motion. Therefore, an integrated Fleet Optimization would be embedded into the Robot Fleet Management System, providing a view of all factors, including demand, traffic, robot health, and other limitations, within a common system. In summary, the objective of optimizing the fleet is simple: optimize the routes to reduce waiting times and increase average utilization without increasing risk.
Therefore, the initial focus of fleet optimization will be on improving routing efficiency. As such, fleet optimization will review the routes taken by the robots, the number of stops made by the robots during the routes, identify areas of congestion on the routes, and update maps as necessary to establish one-way lanes, speed zones, etc., and create staging areas for the robots to travel through. This will ultimately reduce “deadhead” miles (i.e., traveling without a load) and the overall time spent on a mission. Furthermore, dynamic rerouting of robots may help avoid congested or closed aisles or intersections, where robots are at high risk of queuing.
The second opportunity for improvement lies in workload distribution. Fleet Optimization will assign work to robots based on their proximity to the work location, the type of work being done, their remaining battery power, and whether they have other obligations. In addition, the dispatcher within the Robot Fleet Management System will prevent a robot from becoming overburdened, so it does not receive additional assignments until an underutilized robot has received some. Fleet Optimization will also intelligently group work to eliminate trips back and forth between locations (i.e., batching) and enable handoff of work from one robot to another.
Workload utilization is not just about how much time a robot is operating; it is about the amount of productive time it spends. Fleet Optimization will use mission performance data (i.e. missions per hour, average time to perform a pick/drop, average time waiting at stations, exceptions per mission, etc.) to assess whether or not productivity is below expectations due to factors such as robot speed/payload or navigation behavior when using a combination of robots within the same fleet.
Once the reason for the lower-than-expected productivity is determined, Robot Fleet Management can adjust task priorities for each robot, adjust the release timing of upstream systems, or alter station design to improve efficiency and minimize wait times. The value of Fleet Optimization increases when applied to fleets with a variety of robots, as they tend to operate at different speeds, carry different payloads, and navigate in different ways.
Fleet Optimization also helps in controlling how a robot charges. The Fleet Optimization will control when the robots are charged, so they run through charging cycles smoothly and don’t create bottlenecks at the chargers or severely reduce overall available capacity during peak demand. With Robot Fleet Management, you can have robots charge opportunistically, make charging reservations, and travel less distance just to charge.
In addition, as long as you continue to improve Fleet Optimization, you can prevent the positive impacts of Fleet Optimization from drifting away over time. Fleet Optimization needs to be monitored on a regular basis (i.e., weekly, monthly), and you need to develop specific Key Performance Indicators (KPI’s) to evaluate the effectiveness of the program, and then you adjust the Robot Fleet Management policy parameters according to the results. In summary, Fleet Optimization turns routing, workload, and usage into an automatic process that grows with your fleet.
Fleet Optimization Logic
| Scenario | System Decision | Outcome |
|---|---|---|
| Multiple robots available | Assign nearest robot | Faster task completion |
| Traffic congestion | Reroute robots | Reduced delays |
| Low battery robot | Send to the charging station | Continuous operation |
| High workload | Balance tasks across robots | Better efficiency |
| Idle robots | Reassign tasks | Maximum utilization |
Example: Fleet systems dynamically assign tasks to the closest available robot, reducing travel time.
Source: MiR (Mobile Industrial Robots) Fleet Management
https://www.mobile-industrial-robots.com
Step 4: Keep Your Fleet Healthy—Automating Charging and Maintenance
Smart fleet management manages battery life for robots, but that is only one aspect of what it can do. It can also help with predicting when a part of a robot will fail. Just like a check engine light on your car lets you know something has happened with your vehicle before you see the issue yourself, predictive maintenance is a little more advanced. It is as if your vehicle said, “I have collected my performance data over time, and I think I will need a new transmission in about a month”. Predictive maintenance is about identifying an issue before it causes a failure.
Therefore, predictive maintenance systems are designed to fix issues before they occur. This helps increase overall robot productivity by reducing repair downtime. When all parts of a robot fail at once, it is called a catastrophic failure. Catastrophic failures result in a loss of production and revenue for a business. Preventing catastrophic failures through predictive maintenance is a key component of maintaining a successful robotics operation.
Beginning with text. Predictive maintenance would not have been possible without continuous monitoring and diagnostic technology across the robot fleet. By adding Internet of Things (IoT) to robot management, sensors on each robot can monitor slight performance deviations — such as a motor running hotter than normal, a wheel vibrating slightly differently than usual, or a battery taking longer than expected to recharge. These systems learn what is “normal” behavior for each robot and flag small deviations in its performance, prompting a technician to conduct a pre-failure inspection to prevent a major operational delay.
Ultimately, the goal of both automated recharging & predictive maintenance is to minimize the costly operational delays caused by a robot malfunction. A robot that requires brief examination is a minor inconvenience; a robot that breaks down in the middle of a critical pathway is catastrophic. Proactive maintenance increases reliability while saving significant time and money. All monitoring produces valuable information used as the basis for the final stage: analysis.
Mobile Robot Fleet Management: Coordinate autonomous mobile robots efficiently at scale
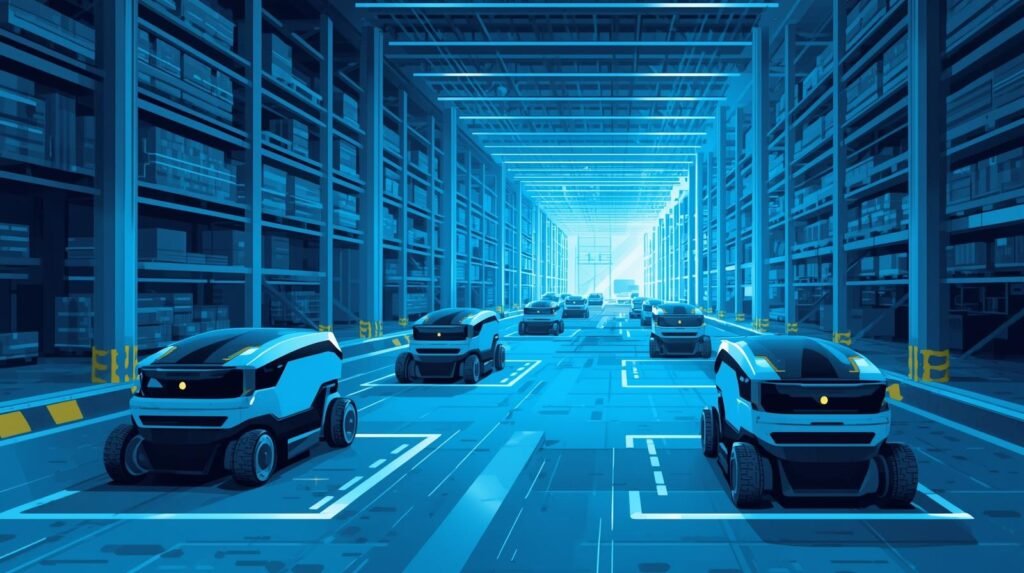
Mobile Robot Fleet Management is a new, developing discipline that coordinates autonomous mobile robots (AMRs), ensures they can safely interact with one another within a facility, and provides an organized way to manage them. As the number of mobile robots increases from a handful to dozens or hundreds, Mobile Robot Fleet Management will be much more important for organizing tasks, providing a common path for all the robots, and improving the predictability of their performance. As such, Mobile Robot Fleet Management represents a subset of Robot Fleet Management. Specifically, it addresses the use of mobile robots to transport materials, components, supplies, or equipment from one point to another.
Mobile Robot Fleet Management also represents one of the main features of the overall process of managing a fleet of robots. One of those main features is dispatching. Mobile Robot Fleet Management uses information about the robots themselves, such as distance, currently being loaded, capabilities, and the amount of charge left on the battery, to determine which robot will be assigned to which task so that no robots are idle at the same time and so that no two robots will be assigned to the same task. Typically, the best way to increase throughput in a Robot Fleet Management system is to use intelligent dispatching rules.
Another major area is traffic coordination. Mobile Robot Fleet Management defines how robots coordinate their interaction with other robots in common passageways, intersections, elevator areas, and work cell areas. Mobile Robot Fleet Management enforces right-of-way rules and speed zone limits, and provides geofencing capabilities to ensure robots do not encroach on restricted areas. It also dynamically reroutes robots based on whether there are obstructions in the aisles and/or people in the path of a robot that will intersect with them. Traffic coordination capabilities enable the Robot Fleet Management objectives of minimizing bottlenecks and enhancing the safety of humans, robots, carts, and forklifts in multi-user applications.
The Mobile Robot Fleet Management application allows operators to view the current locations of robots, mission status, the time robots have waited to enter the next station (queue), and any exceptions from a single screen. Real-time visibility provided by the Mobile Robot Fleet Management application significantly reduces “chase time” for robot issues and improves operator response time when a robot becomes stuck, loses connectivity, or needs assistance.
To be effective at scale, Mobile Robot Fleet Management will require the ability to monitor and control all robots’ charging and uptime. The application can create schedules for rotating robot charging, prevent congestion at charging stations, and monitor robot health signals, including battery degradation, fault codes, and connection loss. Therefore, the use of the Robot Fleet Management application enables users to move from reactive troubleshooting to proactively scheduled maintenance and continuous improvement.
The final component in this regard will be integration. Typically, Mobile Robot Fleet Management will integrate with WMS, MES, or Hospital Logistics Systems to enable automated task generation and prioritization. When performed well, Robot Fleet Management will become an end-to-end workflow engine: upstream systems initiate the work, the fleet system assigns it, and the performance information generated feeds back into the planning process.
As such, Mobile Robot Fleet Management allows the AMR to function as a scalable, coordinated fleet – easier to measure and improve upon over time – and as part of a larger Robot Fleet Management strategy.
Step 5: Become a Data Detective—Using Analytics to Make Your Fleet Smarter
While all of the above monitoring prevents equipment failure, it produces massive amounts of knowledge. Every event, from activities, paths, and every charge cycle, creates a piece of data. This is where the importance of analyzing data comes in: taking these raw numbers and turning them into valuable insights. The management software acts as a detective, constantly monitoring and analyzing your operations to generate insights into how to run them more effectively. Your management software can answer numerous questions for you, such as: Is one of my robots running at a higher efficiency rate than another? At what time of day do I experience the most bottlenecks in my operations?
While there are multiple methods for utilizing this information, presenting it in a clear format makes it easier to understand. Rather than spending hours reviewing multiple spreadsheets, management software can present the data in graphical form. One of the easiest ways to visually represent your data is through a performance heat map. A performance heat map is very similar to a weather map of your warehouse floor, except that instead of representing rain, clouds, and sun, it shows different levels of robot activity using various colors.
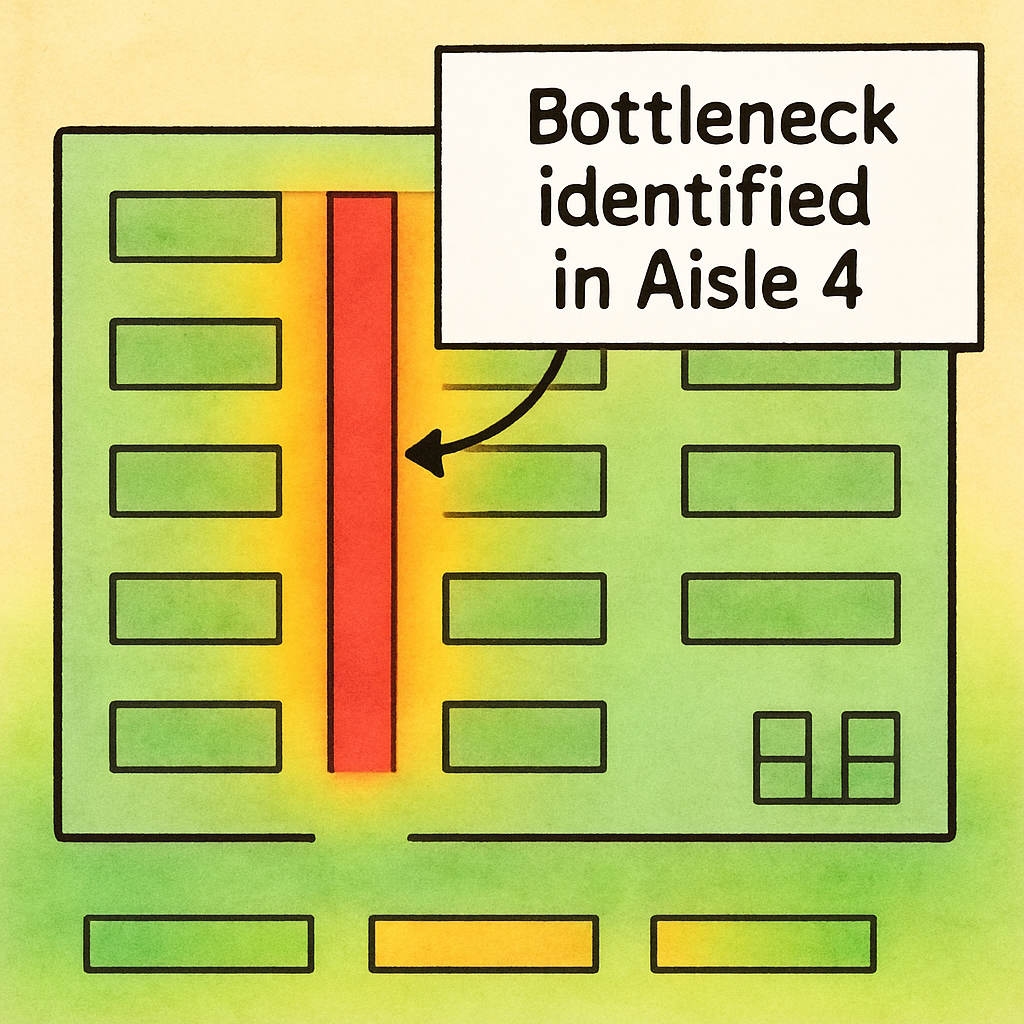
The heat map will allow you to quickly determine where in the environment there are “hot spots,” or locations where the robots tend to become stuck, and “cold spots”, or areas where there is underutilization. In combination with visual evidence of inefficiencies in your fleet of autonomous robots, you can immediately increase overall operational efficiency by individually adjusting each robot’s route and/or modifying the layout of a specific area of operation.
In addition to improving the operational efficiency of your fleet of autonomous robots, the data collected will provide a basis for developing an informed business strategy. For example, when you can demonstrate with data that your existing autonomous robot fleet is operating at approximately 95% of its potential, it changes the nature of the conversation about increasing the number of robots as demand rises. Rather than relying on assumptions, the decision to add autonomous robots to meet growing operational demands can now be supported by factual information.
As illustrated in the previous description of the five-step process, autonomous robots in a single family or fleet can provide numerous benefits to a business. Therefore, the next logical question is: How does the performance of a single-family fleet of autonomous robots compare with that of a multi-family fleet?
Autonomous Robot Fleet: Self-coordinating robots working together intelligently
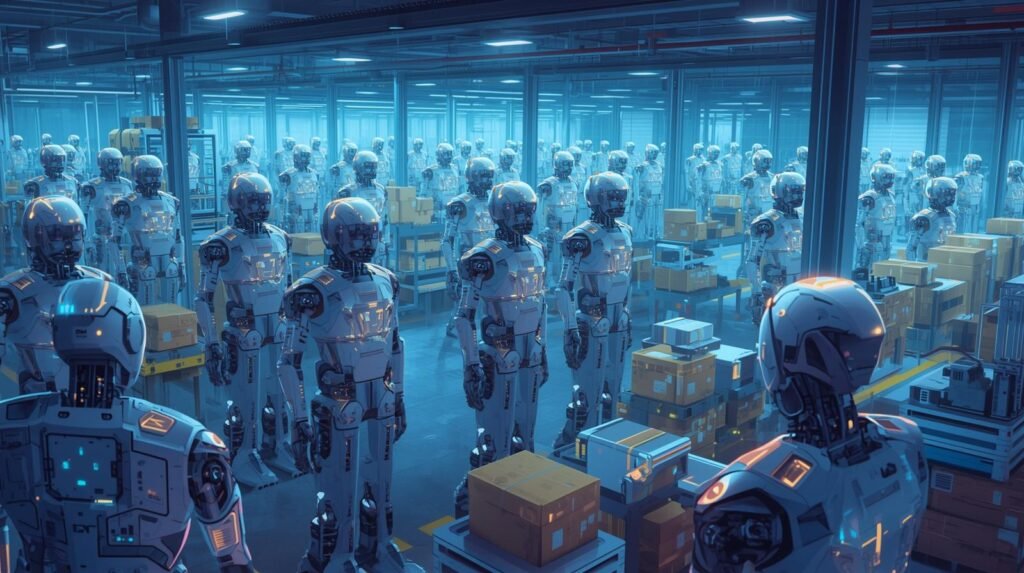
An Autonomous Robot Fleet consists of multiple robots capable of making decisions and navigating their immediate environment while working together in an autonomous or nearly autonomous fashion. The greatest value of an Autonomous Robot Fleet lies not in the individual intelligence of each robot but in the collective coordination to complete tasks, avoid conflict with other members of the Autonomous Robot Fleet, and maintain continued operation under changing environmental conditions.
In most realistic environments, some form of coordination will be required for an Autonomous Robot Fleet to operate effectively, typically including a control layer. An essential component of Robot Fleet Management is the provision of common rules and visibility, which enables the collective functioning of an Autonomous Robot Fleet as one cohesive system. Additionally, Robot Fleet Management can utilize common real-time data sources (i.e., how close a robot is to a given task, a robot’s current payload capacity, the current workload of the robot, etc.) to determine which member of the Autonomous Robot Fleet should perform a specific task. This determination will result in minimizing idle time, eliminating duplicate assignments, and rapid response to high-priority tasks.
The Autonomous Robot Fleet’s capacity to operate in a “safe” manner at scale is another major requirement. An Autonomous Robot Fleet can move safely through intersections, narrow passageways, shared walkways, and mixed traffic with people, forklifts, and other vehicles. To allow multiple robots to move safely, the Robot Fleet Management capability establishes and enforces traffic rules (e.g., right-of-way, speed limits, one-way lanes), creates geofences that define restricted areas, and dynamically reroutes routes to avoid obstacles. If a route is blocked, an Autonomous Robot will pause.
An organized Autonomous Robot Fleet is capable of adapting to disruptions by redistributing tasks among the robots, halting some robots, and redirecting task flow to keep the system moving (not stationary).
Monitoring is important for ensuring reliable operation and detecting operational problems or anomalies in real time in the Autonomous Robot Fleet. The Robot Fleet Manager will utilize data collected from each robot about its status and any faults it may experience to provide alerting and trending capabilities that allow the team to recognize potential problems before they arise and schedule and plan the appropriate maintenance. This capability provides answers to numerous practical questions, such as where congestion occurs most frequently. Where does the initial indication of congestion appear? What behaviors are exhibited by the robots that result in lower throughput?
Integrating the Autonomous Fleet with other systems, such as Warehouse Management Systems (WMS), Manufacturing Execution Systems (MES), and Service Ticket Tool sets, enables automated task creation and consistent prioritization. Once this integration is complete, the Robot Fleet Management System becomes the execution layer. It receives and schedules work for the robots and reports their performance to the planners and operators.
As long as there is predictable coordination, effective safety enforcement, and measurable performance of the Autonomous Robot Fleet, the Autonomous Robot Fleet can be successful. As long as there are established processes, analytics, and governance to support an Autonomous Robot Fleet, it can scale from a pilot deployment to full-scale automation across a facility without transforming daily operations into daily problem-solving.
Autonomous Robot Fleet Benefits
| Benefit Area | Impact |
|---|---|
| Operational efficiency | 20-30% |
| Labor cost reduction | Reduced manual intervention |
| Downtime reduction | Predictive maintenance |
| Scalability | Easily add more robots |
| Accuracy | Fewer operational errors |
Statistic: Autonomous robot fleet can reduce operational costs by up to 30%
Source: MarketsandMarkets Robotics Report
https://www.marketsandmarkets.com
My observation
The primary “angle” for “AI Fleet Management: AI-Assisted Workflows for Autonomous Robotic Fleets” could be to view AI as a Fleet Control Tower Copilot for autonomous robotic fleets; an AI that can turn chaotic, real-world operational processes into repeatable workflows. The focus of this piece should remain on the core concept of closed-loop orchestration — AI uses data from fleet telemetry and environmental signals to determine the most effective course of action, while also learning from the results of those actions to optimize future dispatches.
To develop the narrative, use a workflow stack based upon specific steps: Sense → Predict → Assign → Coordinate → Recover → Improve. For example: predict what will cause congestion in an aisle, create work orders digitally through events triggered by digital twins, dynamically pair two or more robots together (i.e., tug & picker), and have an “exception first” approach to operationally involve humans only when the confidence level drops below some threshold. To differentiate your solution, highlight your ability to automate workflows for edge cases (e.g., blocked paths, groups of low-battery robots, failing sensors, overriding priorities) and to enable AI to trigger automated playbooks.
Finally, as a means to help readers remember this type of AI-assisted workflow management, include a “day in the life” timeline for a fleet manager who utilizes the Copilot dashboard, along with a basic KPI table (throughput, idle time, on-time delivery rate, number of safety incidents) that shows how AI-assisted workflows affect all of these metrics.
Conclusion
Managing multiple devices to ensure consistent, reliable results is known as “robot fleet management.” The 5 steps detailed in this article to help create a reliable robot fleet — visibility, smart task assignment, digital traffic laws, automated charging and maintenance, and using data to improve — will allow you to effectively manage your robots on a daily basis, more efficiently, safely, and reliably than you could manually coordinate.
The largest shift is from tactical (reacting to stuck robots, low batteries, and traffic) to strategic (preventing problems by design). A centralized dashboard provides you with the tools you need to see how things are progressing at all times. Smart dispatches allow for continuous robot productivity with little to no supervisory oversight. Digital “traffic” laws provide for smoother robot flow. Predictive maintenance and battery charging policies protect uptime. Finally, analyzing routine robot usage allows you to make informed decisions regarding route optimization, layout, and personnel allocations.
When expanding your fleet or integrating new types of robots into your existing fleet, interoperability will be just as important as performance. Tools that can operate across multiple vendors and allow you to integrate each vendor’s robots under a single control layer will provide long-term investment protection. When properly implemented, robot fleet management not only reduces chaos but also creates consistent, clockwork-like reliability that supports expansion.
FAQs
- What is robot fleet management (RFM)?
The use of centralized processes and software to manage multiple robots within a single system has enabled “fleet management” of robots. - Why can’t I manage a fleet by controlling robots one by one?
Robot fleets require more than manual, robot-by-robot control because such control does not scale with the number of robots. Manual control can create duplicate tasks, cause traffic jams among robots, lead to unnecessary downtime due to improper charging methods, and result in slower response times when a robot encounters an obstacle or faults. - How does the system decide which robot gets which task?
Fleet management software automates task allocation. This means the best robot for each task is selected based on factors such as its current position, workload, capabilities, priority level, and battery state. - How do fleet systems prevent robotic traffic jams and safety issues?
Fleet management also includes rules similar to those found in “roads”, such as one-way traffic, right-of-way priorities, speed limits, geofences (i.e., digital barriers), and dynamic rerouting if pathways become obstructed or congested. - Can one platform manage robots from different brands? When robots are from different vendors, fleet management software can integrate them into a single dashboard and workflow via interoperability, either through standardization or integration. When evaluating fleet management products, it would be helpful to understand how they enable you to integrate your multi-vendor robots into a single dashboard and workflow.

Garikapati Bullivenkaiah is a seasoned entrepreneur with a rich multidisciplinary academic foundation—including LL.B., LL.M., M.A., and M.B.A. degrees—that uniquely blend legal insight, managerial acumen, and sociocultural understanding. Driven by vision and integrity, he leads his own enterprise with a strategic mindset informed by rigorous legal training and advanced business education. His strong analytical skills, honed through legal and management disciplines, empower him to navigate complex challenges, mitigate risks, and foster growth in diverse sectors. Committed to delivering value, Garikapati’s entrepreneurial journey is characterized by innovative approaches, ethical leadership, and the ability to convert cross-domain knowledge into practical, client-focused solutions.