

















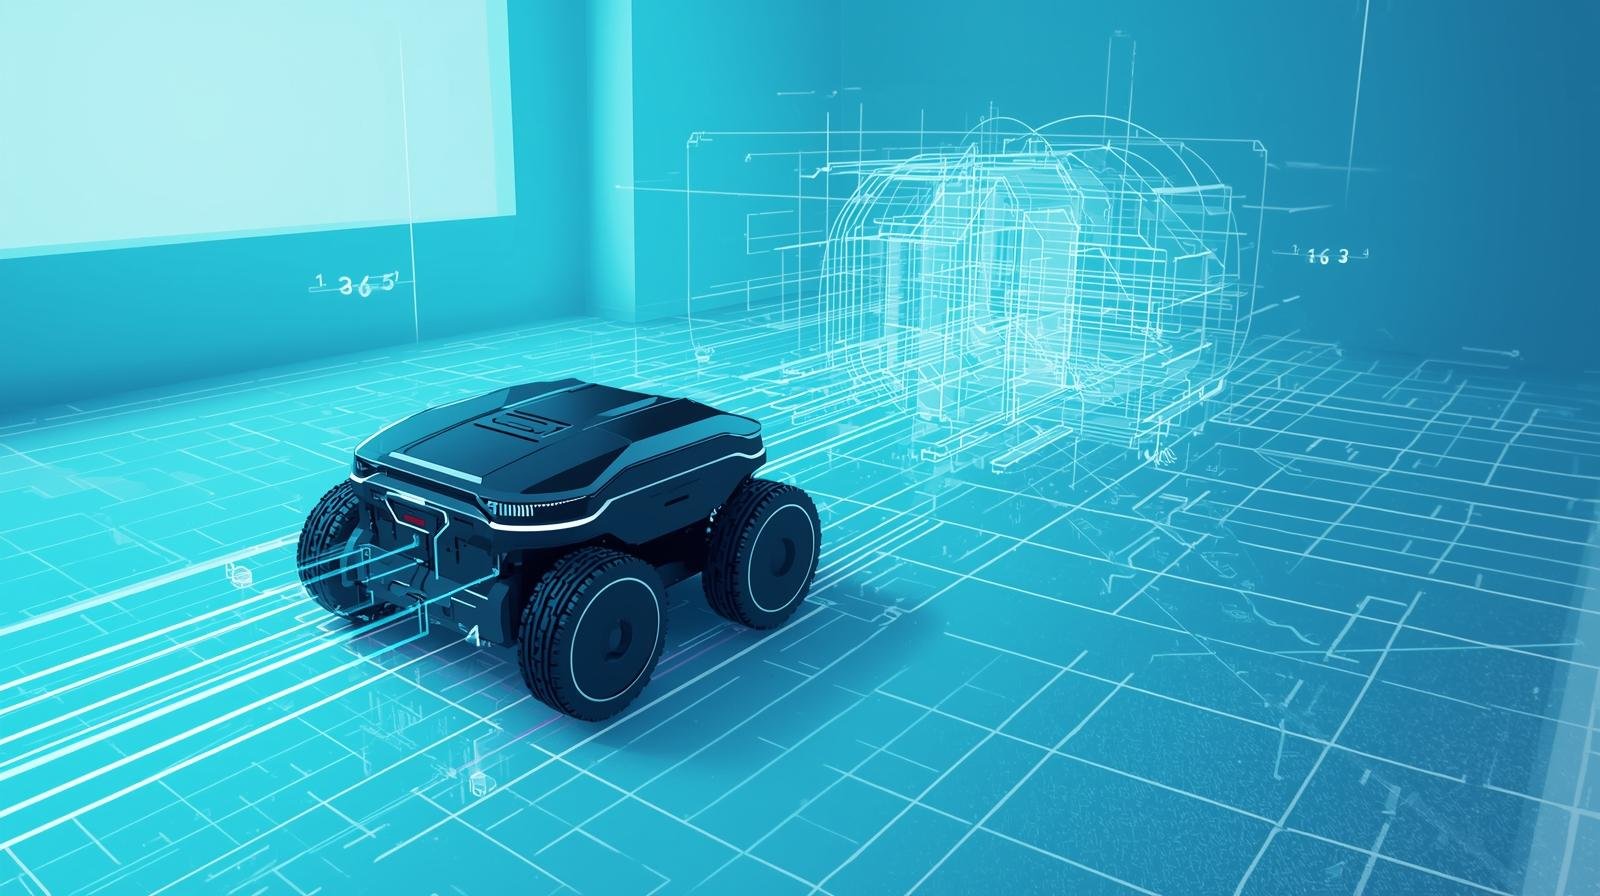
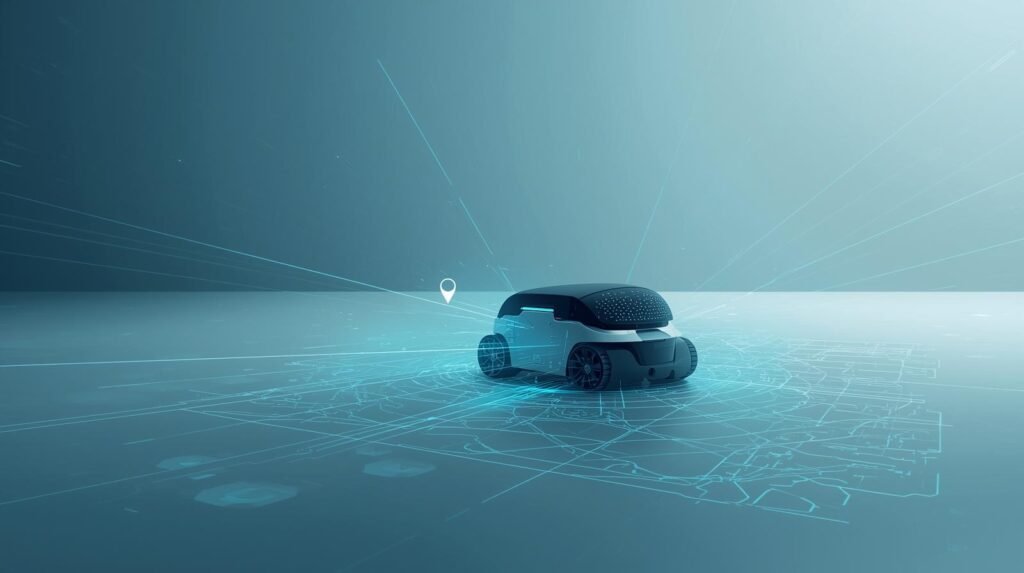
At some point, you may have seen your robot vacuum clean all over your house and thought to yourself, “It seems like it knows right where it is.” This can’t be done using GPS alone. The answer lies in creating a map of the given space (the robot) and determining its location relative to that map as it is created. The ability to accomplish this is the fundamental concept of how robot mapping works in all interior spaces.
to understand why this is such a difficult problem to solve, imagine a shopping mall. The architect’s main task was mapping —creating the very first mall directory. At the same time, as a shopper, your job was to find the “you are here” pin on the existing map. Since most people use existing maps to get from place to place, we usually treat mapping and localization as two totally different jobs. Autonomous robots will have to perform both tasks simultaneously to create a useful map of their environment.
Next, consider a robot entering a building with no directory. In addition to mapping the space, the robot has to determine its own location on the map. How could a robot ever possibly know its location on a map if that map is still being made? The answer to this difficult question forms the base for SLAM.
#Robot Fleet Management: A Smart Essential Guide in 5 Steps
. These sophisticated self-localizing methods for robots allow them to efficiently travel through uncharted areas — whether it is your living room or a cave on Mars.
Summary
This guide describes SLAM (simultaneous localization and mapping) technology, which enables robots to understand their environment and build maps.
Most robots operate in environments with no GPS signal, such as warehouses, hospitals, office spaces, and private homes; therefore, they rely on sensors and sophisticated algorithms to estimate their position, identify obstacles, and generate safe paths.
Plain language explanation of how SLAM works: a robot uses cameras, lidar, wheel odometry, and Inertial Measurement Units (IMUs) to collect observations. The algorithm fuses sensor data to produce an accurate, consistent representation of motion and location.
While the robot moves, its map is updated continuously. When the robot returns to places it has visited before, it identifies landmarks when they reappear. Then it corrects errors by “loop closing” the map back to previously visited locations.
The guide also explains the difference between 2D and 3D mapping, how map quality affects the robot’s navigation, and how planning and control processes convert a map into smooth motion.
Finally, the guide discusses common issues in SLAM, including noise, drift, lighting changes, reflective surfaces, and moving obstacles. The methods used to ensure reliable, accurate robot positioning and location in real-world environments will also be discussed.
SLAM: robots build a map and pinpoint their location in real time
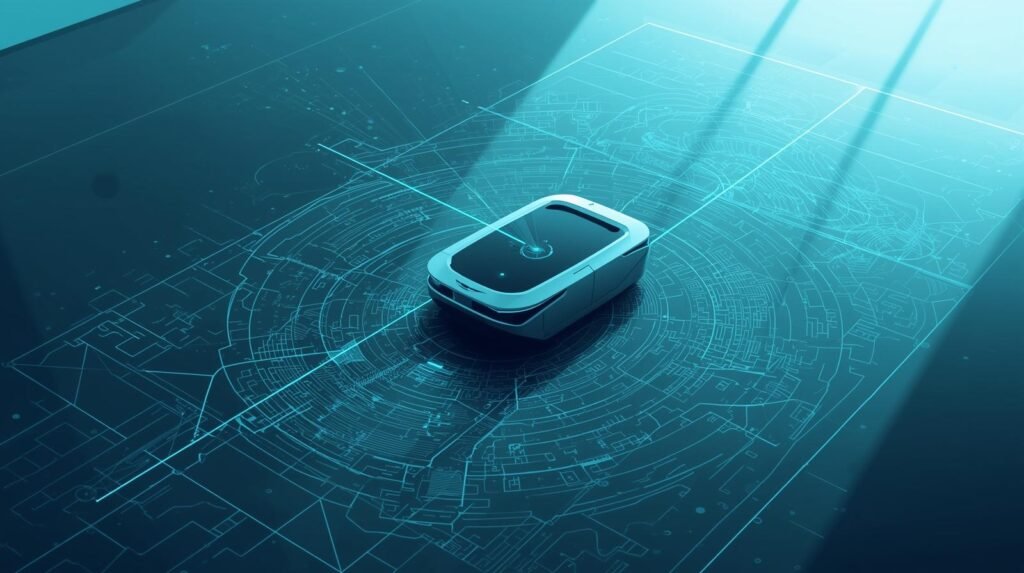
Many robots utilize a technique called Simultaneous Localization and Mapping (SLAM). This method produces a map of the robot’s surroundings and concurrently determines the robot’s current position. To successfully plan safe paths, a good-quality map is required. In addition, without knowledge of the robot’s exact position, the map cannot be updated with the new data. Thus, the continuous updates to the estimated robot position and the maps produced while the robot explores its surroundings resolve both problems at once.
To produce these maps, robots generally employ a variety of sensors, including cameras, LiDAR, radar, wheel encoders, and inertial measurement units (IMUs). These sensors are used to gather data regarding the robot’s surroundings. When data from each sensor type is combined using various techniques, the overall understanding of the robot’s environment improves. While the robot is moving through its surroundings, the SLAM system will estimate how the robot moved based upon the feature tracking in the environment (corners, edges, etc.) and compare what the robot is seeing now to what it saw a short time ago to help determine motion, detect drift, and correct any errors that were generated.
Upon completing an exploration of the area, the SLAM system will produce a 2-dimensional floor plan for the interior navigation of a robot or a 3-dimensional map for an aerial or land-based autonomous vehicle. The final map may be represented as a grid indicating occupied vs. free space, a set of landmarks representing individual objects or points of interest, or a point cloud representing all sensor measurements taken during the robot’s exploration.
Because the mapping process occurs in real time, the robot can respond to newly discovered obstacles during operation and modify its internal map representation. Also, many successful SLAM systems have loop-closure capabilities, which allow the robot to recognize when it has returned to a previously mapped area and to align the map.
Trade-offs among different algorithms exist. Visual SLAM will work effectively in environments with sufficient texture and lighting, given the camera’s aspect ratio; low light will degrade its performance. Lidar-based systems provide accurate distance measurements in low-light or dark environments; however, sensor costs can be high. The most effective method is to combine cameras and Lidar-based systems, and add GPS when operating outdoors. Indoor SLAM can be found in many places, such as in warehouses, hospitals, and homes, and can include tasks such as item delivery, floor cleaning, and walking escort.
To summarize, SLAM is a major part of dependable autonomy.
SLAM technology is not magic. Math provides a solid foundation for SLAM technology. Fast motion, shiny objects/surfaces, and crowded areas can confuse sensor data, and small errors can compound over long distances. As a solution, engineers have developed improved methods for calibrating the system, including probabilistic filters and uncertainty-aware optimization methods. Engineers also create maps that are compact enough to be processed on embedded hardware.
As processing speeds increase and learning-based perception continues to improve, SLAM technology will transition from labs to consumer-grade products, enabling robots to navigate the world with confidence.
Example
The security robot begins by docking at a charge station in an empty building. The robot then uses LiDAR to detect walls and doors and wheel odometry to estimate small movements. It will continue to update its position through SLAM using an occupancy grid. For example, if a chair is placed in the hallway at 2 am, the robot can add this to the occupancy grid for that location, while keeping the original map of all rooms intact. After some time has passed and the loop closure from the SLAM process corrects the total error of where the robot was, so that it may return to the exact dock every night.
The Real Challenge: Solving the “Lost in the Dark” Problem
The localization and mapping problems are two that a robot must solve to get its bearings. Localization is the problem of determining a robot’s location. Mapping is the problem of creating a representation of the world around the robot. These are not independent problems. A robot cannot use its localization system to create a map unless it already knows where it is.
This situation is called a “chicken-and-egg” problem. That means, if you want to add a leg of a chair to your mental map, you must first know the exact location where you added that leg. However, before you can find the exact location where you placed the leg, you must have a map with the positions of the landmarks that you used to find that leg. This is the reason why SLAM (Simultaneous Localization and Mapping) is considered one of the most difficult technical challenges facing roboticists today.
As such, when a robot is attempting to solve the SLAM problem, it does not try to solve it completely. Instead, it tries to solve it through many small iterations or loops. A robot starts by estimating its location. After it makes this estimate, it moves a little. As it moves, it uses its sensors to determine how far away it is from certain objects. Once it reaches its new location, it determines again how far away those objects are. If the object is farther than the robot thought it should be, the robot updates its estimated location.
#Virtual Robot Testing: Smart & Powerful Ways to Save Time and Money
A loop of guessing, measuring, updating, and repeating continues until the robot completely maps the environment. This is how an entirely new robot vacuum cleaner can clean your house and navigate through each room without you providing a floor plan. But for this to happen, the robot must be able to perceive its environment, including landmarks (walls, etc.), to start cleaning. Which method(s) the robot uses to perceive the environment (e.g., a laser beam or a camera to view landmarks) is another part of the puzzle.
The “Lost in the Dark” Problem Breakdown
| Situation | What Goes Wrong | Why It Happens | SLAM Solution |
|---|---|---|---|
| No GPS indoors | Robot loses position | GPS unavailable | Users sensors + mapping |
| Dark environment | Camera fails | No visual features | LiDAR detects surroundings |
| Repetitive corridors | Confusion in location | Similar patterns | Loop closure detection |
| Dynamic obstacles | Map becomes outdated | Moving objects | Real-time updates |
Example: Warehouse robots operate in GPS-denied environments using SLAM.
Source: MIT CSAIL – SLAM Research
https://www.csail.mit.edu
How Robots “See” a Room: Using Eyes vs. Using Lasers
A robot has to “experience” a room before it will build an accurate map of that room, and that is when its ‘eyes’ and ‘ears’ become useful. There are really just two approaches for a robot to create a map of a room, and they are about as different as night and day.
The first is Visual SLAM, and is by far the most common method. It simply uses a camera (like a smartphone camera) and analyzes the video feed for the same kinds of visual characteristics we use to remember rooms (the sharpness of a doorway’s edge, the pattern of a rug, a picture frame on a wall). When the robot finds a visual fingerprint or characteristic, it can use those characteristics to create its map and determine its current location. In essence, the robot can locate itself by relating its current view to other views it has seen previously.
LiDAR (Light Detection and Ranging) is a second popular technology for performing SLAM, using a form of ‘touch’ rather than vision. A LiDAR sensor sends thousands of laser beams around a complete circle and detects how far away objects are when they are hit. From the data collected by the LiDAR sensors, the robot can build an extremely accurate three-dimensional “connect-the-dots” model of its surroundings. This means the robot identifies an object’s dimensions and location, rather than simply identifying it by comparison with a photograph of a chair.
Ultimately, both visual and LiDAR SLAM produce two completely different types of maps. The visual SLAM produces a map of recognizable features, while the LiDAR SLAM produces a map based on specific geometric attributes. Therefore, which sensor(s) used (visual or LiDAR) will be dependent upon the task at hand, the environment in which the robot will be operating, and ultimately, the cost.

Sensor Comparison for SLAM
| Sensor Type | Strength | Weakness | Best Use Case |
|---|---|---|---|
| Camera (Visual SLAM) | Low Cost, rich detail | Sensitive to lighting | Indoor robots |
| LiDAR | High accuracy, works in dark | Expensive | Autonomous vehicles |
| IMU | Tracks motion instantly | Drift over time | Motion tracking |
| Ultrasonic | Simple obstacle detection | Low precision | Short-range detection |
Statistic: LiDAR-based SLAM can achieve cm-level accuracy in controlled environments.
Source: IEEE SLAM Survey
https://ieeexplore.ieee.org
Sensor Fusion: Combining camera, LiDAR, and IMU data for accuracy

Sensor fusion uses information from multiple sensors to generate a solid, steady, and dependable indication of motion and environment that no individual sensor could accomplish on its own. Sensor fusion is a key element for robust SLAM in practical settings. Most of the SLAM research has been conducted in laboratory environments due to the limited availability of the real-world environmental disturbances that sensor fusion was designed to address.
A camera captures many visual details about an environment, such as textures, edges, and landmarks. The camera allows the robot to determine its own location or the location of nearby items and track their movement over time. Cameras do not perform as well in low-light conditions, in areas with motion blur or glare, and in featureless corridors. A LiDAR sensor provides highly accurate distance and geometric measurements of objects. The LiDAR also generates a detailed 3-Dimensional representation of the environment. Even in completely dark spaces.
A combination of LiDAR and an Inertial Measurement Unit (IMU), both of which are widely available and inexpensive, represents a potential solution to this problem. Each of these sensors has significant advantages but also disadvantages. For example, LiDAR is affected by “noise” when nearby reflective surfaces are present, and it generally cannot detect very thin objects. In contrast, an IMU can measure a great deal of information about the robot’s motion at a very high sampling rate. As such, an IMU would be an excellent choice for estimating the robot’s motion over short time intervals.
Unfortunately, because an IMU lacks reference points, the estimated motion of the robot will slowly drift from its true motion. Therefore, sensor fusion, which combines the strengths of one sensor with those of another while compensating for their weaknesses, provides an effective method for improving the accuracy and reliability of SLAM.
Sensor fusion in SLAM typically involves synchronizing and calibrating all sensors so that they measure the same point in space at the same time. When the robot is moving quickly, the IMU can provide rapid estimates of the robot’s state between successive camera images and/or LiDAR scans. This prevents loss of track due to unreliable measurements. While the IMU provides an estimate of the robot’s motion, the LiDAR and/or camera measurements correct the robot’s position and orientation.
The process described above is similar to a loop found in many of today’s SLAM algorithms. The IMU provides the prediction phase, and either the LiDAR or the camera provides the correction phase. Sensor fusion has been shown to significantly improve the accuracy and stability of SLAM.
#Hybrid Cloud Edge Robotics – Smart Essential Guide
Sensor Fusion is the integration of multiple sensors to create a unified data stream. Indoor applications may benefit from camera/IMU Sensor Fusion, which is generally lightweight and inexpensive; however, LiDAR sensor fusion could be beneficial in low-light conditions and repetitive hallway layouts.
Outdoor applications will utilize sensor fusion to enhance performance with GPS (when available). Even when GPS is unavailable due to building or tree canopy blockage, the performance enhancement from sensor fusion will still benefit SLAM.
Sensor Fusion produces better, more consistent mapping, supports reliable loop closure, and greatly reduces jitter associated with unpredictable, erratic robot movements.
Overall, sensor fusion provides a solid foundation for developing dependable autonomous systems. Through sensor fusion, SLAM can maintain accuracy in near real time, function when one sensor fails, and produce maps and positional information reliable enough for robots to use for navigation.
Example
Sensor Fusion is being used in a delivery drone. It utilizes a forward-facing camera, a spinning (360°) LiDAR unit, and an Inertial Measurement Unit (IMU). The IMU estimates large rate changes from wind gusts. The camera detects objects visually on rooftops. The LiDAR provides distance measurements to facades and power lines.
The fused state estimator reduces the effect of camera blur caused by acceleration and lowers the weight of LiDAR returns affected by rain, which can create spurious returns. Through sensor fusion, the drone’s position/pose estimate will be smooth and have very little latency, which enables its controller to maintain a narrow corridor of flight through building density and allow it to stop directly over the drop area, even with GPS loss for short periods while flying in dense city areas near sunset.
Sensor Fusion Impact Table
| Configuration | Accuracy | Reliability | Example |
|---|---|---|---|
| Camera only | Medium | Low in dark | Phone AR apps |
| LiDAR only | High | Stable | Autonomous cars |
| IMU only | Low | Drift issues | Motion tracking |
| Camera + IMU | High | Better tracking | Drones |
| LiDAR + Camera + IMU | Very high | Robust in all conditions | Advanced robots |
Statistic: Sensor fusion improves localization accuracy by 30-50%
Source: NVIDIA Robotics Research
https://developer.nvidia.com
Simultaneous Localization and Mapping: Mapping the environment while tracking the robot’s position.

Simultaneous Localization and Mapping (SLAM) enables robots to create a map of an unknown environment and determine their current position within it. Unlike many robotic systems that rely on pre-existing or predefined maps of the environment, a robot uses sensors to determine how much of the environment it can see and from which locations it needs to observe it in order to understand the environment.
Localization answers the “where am I?” question, and mapping answers the “what does the world look like?” question. However, each question depends on the other: to localize your position, you need a high-quality map, but to place new map points, you need a reasonably accurate estimate of your current position.
Therefore, to address the interdependence between localization and mapping, SLAM will continuously update both processes simultaneously.
A simple representation of how a Simultaneous Localization and Mapping cycle can be implemented is shown below. The first step for the robot is to predict its motion based on a combination of wheel odometry and Inertial Measurement Unit (IMU) measurements. After predicting its movement, the next step is to compare the current sensor data, either from camera features or LiDAR point clouds, with previously acquired sensor data.
When the comparison yields an acceptable match, the robot adjusts its estimated pose and updates or adds map data for the area. By repeatedly correcting the estimated pose using additional sensor data, the errors associated with drift that would otherwise accumulate as the robot moves will begin to decrease.
Due to the need to operate in real time, Simultaneous Localization and Mapping relies heavily on effective probabilistic methods to provide adequate solutions. Many implementations of SLAM utilize both filter-based and graph-based optimization methods to represent uncertainty, thereby conveying the robot’s confidence in each estimate. Therefore, many SLAM implementations may appear relatively robust to noisy sensor readings.
Another important aspect of Simultaneous Localization and Mapping is the inclusion of “loop closure,” which allows the robot to identify previously visited areas and correct the map accordingly, preventing distortion from the accumulation of errors. Since loop closure is essential for long routes, it provides a measure of how well a Simultaneous Localization and Mapping implementation performs in practical applications.
The type of sensor you have determines how efficient your Simultaneous Localization and Mapping application will be. Cameras can obtain a great deal of useful visual data (i.e., identify a large number of distinct features). On the downside, cameras may be difficult to utilize in low-light conditions.
On the flip side, Light Detection and Ranging (LiDAR) sensors determine the distance from an object and thus can be used to create a highly accurate 2-dimensional representation of the environment. However, LiDAR sensors can sometimes confuse objects that are transparent (e.g., glass) or objects that have very reflective surfaces. As such, most SLAM software packages use a hybrid model that combines a camera sensor with a LiDAR sensor to capture the environment’s appearance and geometry simultaneously.
When evaluating a team’s Simultaneous Localization and Mapping system, there are three primary performance metrics: accuracy, robustness, and the map’s usability for future navigation planning. When implemented properly, Simultaneous Localization and Mapping enables robots to operate in indoor environments (e.g., warehouses, office spaces) and/or outdoor environments with a minimum of initial setup and allows them to continue operating in those same environments as the physical layout changes.
Example
A Cave Exploration Rover Enters a Tunnel Without Any Previous Map. As it moves through the tunnel, Simultaneous Localization and Mapping will determine its location and create a 3-dimensional representation of the tunnel. The Simultaneous Localization and Mapping process registers each LiDAR scan against all previous scans to enable motion estimation. Motion uncertainties are also tracked using a graph.
At some point during this exploration process, the Cave Exploration Rover will reach a junction, at which point the Simultaneous Localization and Mapping algorithm will evaluate possible paths (left turn vs. right turn) to determine which provides the best consistency. Once the best path is determined by the Simultaneous Localization and Mapping algorithm, the map will be updated. Days after the first LiDAR scan was taken, Simultaneous Localization and Mapping will recognize a distinct cluster of stalagmites from earlier in the tunnel and perform loop closure on the entire tunnel shape. After loop closure is performed, the entire tunnel shape will be corrected and can then be sent to rescue teams.
Robot Navigation
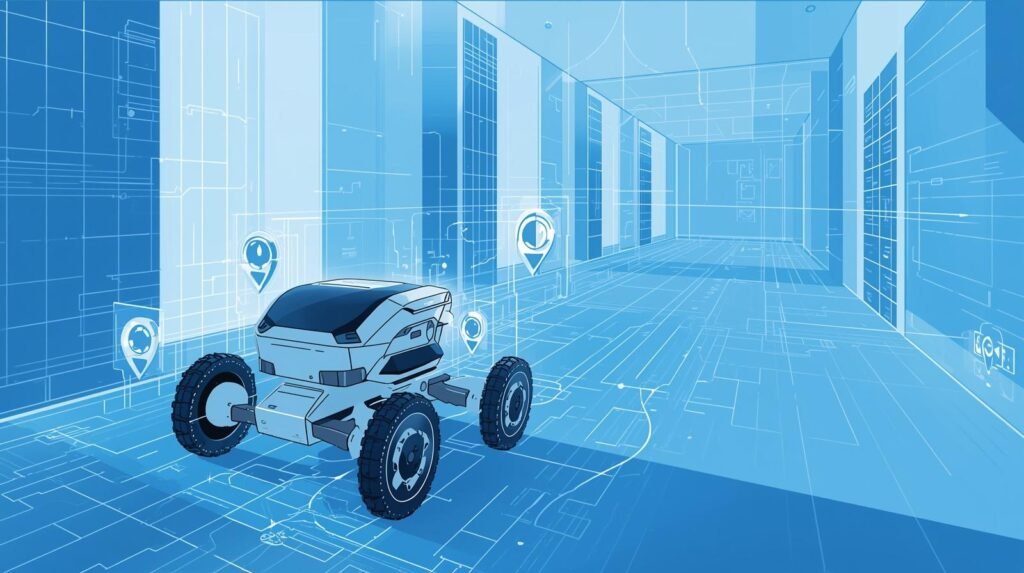
One of the key parts of Robot Navigation is the robot’s ability to travel through a space safely and meaningfully, without prior knowledge of the space. When a robot enters a new space without prior experience, Robot Navigation begins with perception. Perception for Robot Navigation is the process of collecting sensory input from various sensors on the robot, including cameras, LiDAR, sonar, and inertial sensors. The robot collects this sensory information to identify potential hazards, including walls, doors, people, and drop-offs.
Sensor data collected by the robot is usually noisy. This means the robot must rapidly interpret sensor data to react quickly in real time.
Another important component of Robot Navigation is the robot’s understanding of its own pose (position and orientation) of the robot. Many systems use a method called SLAM (Simultaneous Localization And Mapping), to help establish the robot’s pose, and to create a map of the robot’s environment, when GPS is either not available or is unreliable.
As the robot creates a more accurate map of the environment using SLAM, Robot Navigation will be consistent over longer distances and in more complex spaces.
Once the robot has estimated the amount of available empty space, the Robot Navigation system transitions to the planning stage. The planning process within Robot Navigation consists of two stages: global planning and local planning.
Global planning determines the best path from the robot’s current position to the final destination (e.g., a docking station), while local planning continuously adjusts the path to avoid moving objects.
The robot will weigh multiple factors when determining which route to take to the goal (destination), such as the distance to the goal, how much space needs to be maintained between the robot and any hazards (the robot’s safety margin), and how much energy the robot will need to expend to make a turn (turning cost). The robot will choose the best sequence of motion based on the total weight of all these factors.
SLAM also improves the robot’s ability to plan its route. Because the map created by the robot provides a more accurate representation of the environment, it can more accurately predict which routes will include narrow areas or dead ends. Overall, this results in a better planned route.
The final stage of control is to transform a path plan into actual motor commands. Robot Navigation uses controllers to address all disturbance sources (irregular floors, bumps, etc.) and sensor delays, so that the robot remains on its desired path. When the robot determines it has deviated from the planned path, the controller will either direct the robot to return to the path or initiate replanning based on the detected error.
When the environment changes (e.g., a door closes), the Robot Navigation system must determine when the change occurs and decide whether to choose an alternative path rather than attempt to pass through the new obstruction. Robust Robot Navigation includes recovery actions, such as reversing out of an obstacle, pivoting to reorient the robot, and slowing down to improve sensor tracking.
SLAM enables the inclusion of these recovery actions and provides a degree of confidence in the map’s accuracy. Consequently, if confidence in the map decreases during mission execution, the robot can slow down to gather additional data before continuing navigation.
Example
The cart is first driven by the hospital’s navigation system from the pharmacy to the ICU. After this, the cart will continue to be steered by the cart’s local planner (also referred to as Local Planner) using data from the cost map (created using depth sensors). This allows the local planner to maintain additional space around the bed and IV pole in case of obstacles.
Robot Navigation creates a global path that avoids the elevator under construction. It also continuously replans if a gurney blocks its way. When Robot Navigation encounters an intersection, it uses its current heading to navigate through tight spaces, such as door frames. When Robot Navigation approaches other people walking or in vehicles, it slows down and yields. If Robot Navigation’s wheel slips due to water on the ground, it adjusts its speed accordingly, then localizes itself again, and continues driving.
SLAM Workflow Pipeline
| Step | What Happens | Output |
|---|---|---|
| Data collection | Sensors capture the environment | Raw sensor data |
| Feature extraction | Identify edges, landmarks | Key features |
| Pose estimation | Calculate | robot postion |
| Mapping | Build/update map | Environment map |
| Loop clousure | Detect revisited places | Corrected map |
Example: Robot revisits the same location – corrects accumulated error.
Source: Google Cartographer SLAM
https://google-cartographer.readthedocs.io
Robotics Navigation: Core technology enabling autonomous robot movement
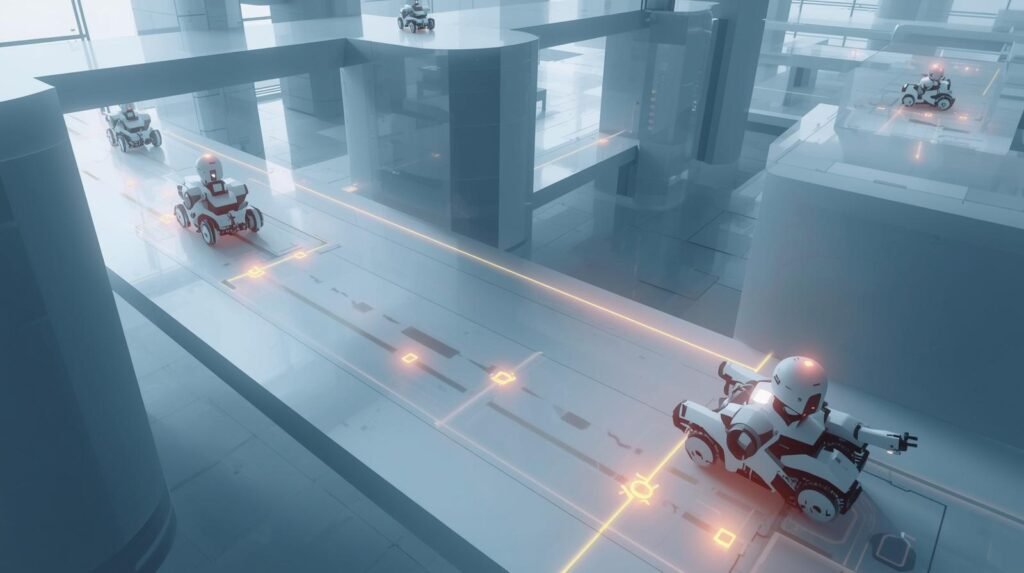
A single continuous loop is present in Robotics Navigation as it combines Perception, Localization, Mapping, Planning, and Control, all of which occur in real time.
The first part of Robotics Navigation is Perception. A robot gathers information about its environment through a wide range of sensors, including cameras, LiDAR, Radar, Ultrasonic Sensors, Wheel Encoders, and Inertial Sensors.
This data is then transformed into usable signals that represent Obstacles, Free Space, and Motion Estimates. Each type of sensor has unique limitations and most robotics systems utilize multiple sensors to ensure more reliable and consistent decision-making.
Another essential element of Robotics Navigation is Localization. Localization refers to the robot’s ability to identify its current pose (position and orientation). Many robots cannot use GPS indoors because it is often unreliable. Therefore, most indoor robots use SLAM (Simultaneous Localization and Mapping) to determine their pose. This is accomplished by creating a map of the environment from sensor data. A primary advantage of using SLAM is that it limits the amount of drift caused by wheel slip and small measurement errors. When a robot returns to an area it has previously mapped with SLAM, it can re-anchor itself and prevent a loss of map accuracy.
The first part of Robotics Navigation is Perception. Perception is defined as a robot’s gathering of information about its environment using a number of sensors. These include cameras, LiDAR, Radar, Ultrasonic Sensors, Wheel Encoders, and Inertial Sensors.
There are many types of SLAM, depending on the sensors used and the constraints of the applications in which they are used (e.g., cost). An output of the mapping portion of the robotic navigation system is a current picture of the area, including passable and restricted space, as well as other structural elements (walls, shelves, etc.) in the environment. Additionally, if a SLAM algorithm is used, the map generated by the robot will be continually updated as the robot explores the environment and the environment changes.
Following the mapping is the planning. A global planner finds the shortest possible route from point “A” to point “B”; a local planner adjusts the planned path based on environmental changes as the robot moves along it. A person stepping into the robot’s aisle or a shopping cart suddenly appearing in front of the robot are examples of environmental changes. Local planning enables the robot to rapidly replan a path back to the originally planned path, without losing its position on the map, using SLAM.
Lastly, the control phase of robotic navigation involves converting the planned path into speed and steering commands that the robot can execute. The robot’s ability to follow the path, stop at the correct location, and recover quickly and smoothly as uncertainty increases is enabled by the continuous positioning information generated by SLAM.
Example
A warehouse uses robotics navigation as part of an autonomous forklift pallet put-away process. The robotics navigation system integrates map data from pre-existing sources (i.e., aisle labels), real-time obstacle detection using sensors mounted on the forklift (e.g., ultrasonic, LiDAR), and the dynamic motion of the forklift in order to select movements that do not result in tipping the load being carried by the forklift. Once a route has been selected, it is broken into a two-level process; first, a global level representing the overall path or “route” of the forklift throughout the warehouse (including multiple levels of storage).
Next, a local trajectory is created showing where and how quickly the forklift will navigate down the chosen aisle, based on factors such as worker presence, stationary carts/pallet jacks, etc. Additionally, Robotics Navigation limits the forklift’s speed at designated locations (crosswalks) and allows slightly larger turning radii when the forks are raised. If a partial obstruction is present in a rack bay, Robotics Navigation selects an alternative location for the pallet and adjusts the original task accordingly.
Real-Time Mapping: Maps updated instantly as robots move
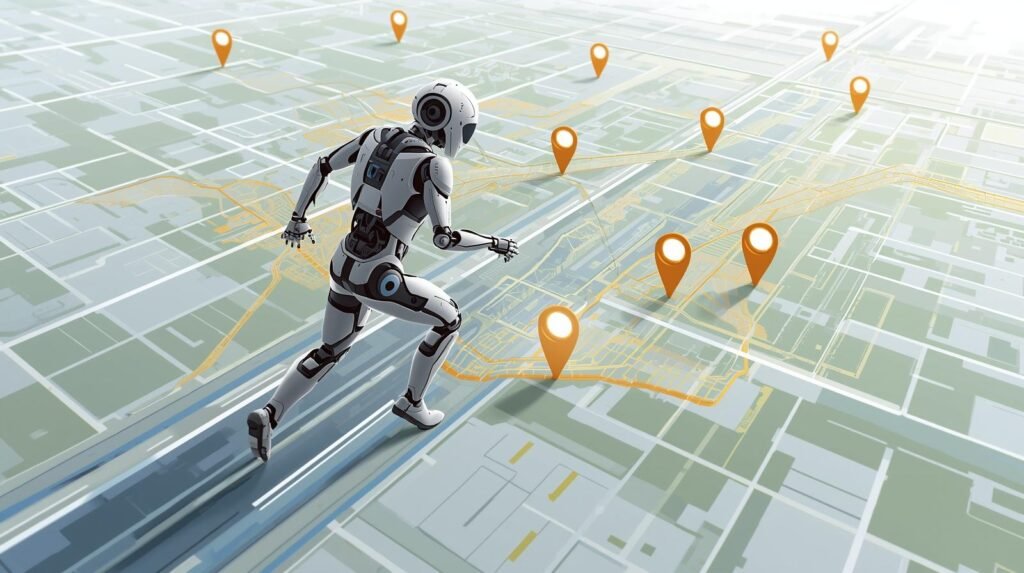
Real-Time Mapping allows a robot to get a new image of the world after every move. It doesn’t rely on having a pre-existing map of the environment. The application of Real-Time Mapping is found in changing environments. These could be areas where people can walk through; doors can open and shut; pallets can be left in aisles; or items can be moved around. To navigate these changing layouts safely and efficiently, the robot needs an up-to-date map of the environment.
The robot uses a continuous stream of sensor data (i.e., cameras, LIDAR, Radar, Wheel Odometry, and IMU) to create a real-time model of the free space and obstacles in the surrounding environment. For the robot to effectively use Real-Time Mapping, it requires the ability to rapidly perceive surfaces and objects and to perform accurate calculations that account for how the robot’s motion influences its field of view.
Real-Time Mapping depends on how well the robot can determine its position relative to its environment. While most systems use simultaneous localization and mapping (SLAM) to estimate the robot’s pose and create and correct the map, the process of SLAM involves detecting and eliminating drift caused by minor errors in wheel slip or sensor noise. When this happens, the robot’s current observation is compared with previously observed features.
When a high-quality SLAM pipeline is used, new map updates are generated from the robot’s accurate position, regardless of whether the robot has made rapid turns or traveled long distances.
Real-Time Mapping initiates a new plan to slow the robot down, divert it around obstacles, or stop it as soon as it detects a change, such as an obstacle. Real-Time Mapping also supports loop closing. When the robot returns to a previously mapped location, the mapping system will correct any warping that occurred during the initial mapping process.
A good Real-Time Mapping system reduces computational cost by compression of collected data, limiting the number of frames used to create a map (keyframes), and/or reducing the detail of distant objects relative to nearby ones.
Ultimately, Real-Time Mapping enables practical autonomous systems. These autonomous systems can operate in dynamic environments with adequate clearance, enabling robots to reach their goals safely and reliably.
3D Mapping: Creating detailed 3D maps from robot sensor data
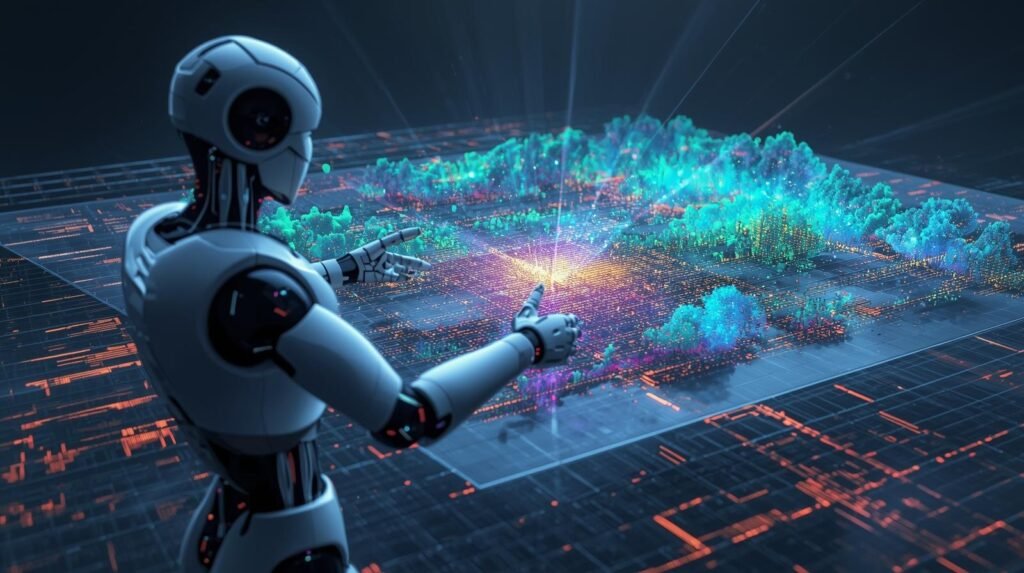
3D Mapping is the technique for creating high-resolution 3D representations of environments from a robot’s sensor input. One of the primary advantages of 3D Mapping is the ability to include height, shape, and depth. Thus, 3D mapping will be required for all types of autonomous systems: drones, legged robots, warehouse vehicles, and inspection robots that have to traverse uneven terrain, including stairs, ramps, and shelves.
Normally, 3D mapping uses a variety of sensors, such as LiDAR, depth cameras, stereo cameras, and radar, to produce a “slice” of the world based on the robot’s location at that moment. When individual slices of the world are used to build a single map, the robot must determine how it traveled from one slice to another. This is often where SLAM comes in, as it allows tracking of the robot’s movement while simultaneously improving its map and correlating the new point cloud and/or depth image with previously produced ones.
In addition, several methods can be used to represent space in 3D mapping models. These can include point clouds, voxels, and meshes. Point clouds are easy to create and very useful for obstacle detection. Voxels are good for determining the spatial relationship between occupied (blocked) or unoccupied (free) space. Meshes are also effective for visualizing an area for inspection purposes. They use less memory than voxelized representations, but meshing takes longer and requires greater computing power.
As 3D mapping becomes more advanced, these memory-related issues will be resolved through a variety of techniques, including downsampling data, retaining only key frames, and/or dividing large areas of space into smaller sub-maps, which can then be combined upon completion.
Because robots’ sensors are never perfectly accurate, accumulated errors from wheel slip, motion blur, and interference from reflective surfaces can distort measurements and cause feature misalignment, leading to “ghosting” in the map. However, SLAM (Simultaneous Localization And Mapping) minimizes or eliminates this type of problem through feature/structure alignment across multiple observations of the environment and through loop closure, in which the robot revisits a previously mapped area. The reliability of 3D mapping using SLAM enables clear, sharp 3D maps at long distances and provides a model that supports both the operator’s navigation and analysis needs.
Beyond the operational need to navigate the robot in an indoor/outdoor environment, 3D mapping has many high-level uses. For example, 3D mapping can assist in identifying potential overhangs, narrow clearance paths, and traversable slope angles. Industrial inspections also benefit from 3D mapping, as it helps identify structural deformations, missing parts, and discrepancies in inspection findings compared with previous visits. Finally, 3D mapping provides the realistic spatial context necessary to develop meaningful Augmented Reality (AR) experiences and Digital Twin representations of the real-world physical environment.
Therefore, 3D mapping takes unprocessed sensor data and produces a measurable, navigable world model. However, through SLAM, which provides consistent position tracking and error correction, 3D mapping becomes reliable and accurate enough for autonomous operation rather than just creating visualizations.
The “Aha!” Moment: How Robots Fix Their Mistakes
The robot creates a model of its area using dead reckoning. Dead reckoning is essentially the way you might travel a great distance through unknown terrain without having a gps, by guessing your position based on where you have come from and what direction you traveled. Each time the robot makes a guess about its position, there will be some error in that guess. While this error may be very slight, eventually the accumulation of these errors may cause the robot’s model of the world to become distorted.
Using the previous analogy of being lost in a dense forest, as you continue to move forward, the further you get away from where you started, the greater the chance that you will find yourself somewhere that does not match what you thought was in front of you. As the robot travels through the space of its environment, the same kind of problem occurs. The robot may create multiple representations of the same hallway or misalign the walls.
Once the robot’s internal model of the world is no longer accurate, it can correct it when it finds something it previously knew. Using the earlier analogy, when the robot locates its charging dock, it knows exactly where it is. This is true since the charging dock is the only object that has been mapped and remains intact today. At this time, the robot can align all other objects around the charging dock and has a highly accurate representation of its surroundings.
Visual SLAM vs. LiDAR SLAM: Which is Better?
There are some similarities between how lasers function and how cameras function. Therefore, the next question is: if manufacturers understand how both types of devices function, how would a device manufacturer decide which type to manufacture?
The answer to this question lies in the old adage in engineering: getting performance versus getting it cheaper. There is no “right” way to perform a task, simply the right way to get the job done with respect to the task you are trying to accomplish.
Visual SLAM has several benefits over LiDAR SLAM. First, cameras are relatively inexpensive and take up much less space than LiDAR. Second, because cameras function like the human eye, they have many of the same limitations. For example, cameras cannot effectively see in low-light situations, nor can they see in areas with little to no visual cues, such as a large empty hallway. As a result, a robot attempting to travel through an area with no visual landmarks is much like a person attempting to travel through the desert without any signs.
On the other hand, LiDAR SLAM systems are highly accurate. Because LiDAR systems emit laser beams to determine distances between objects, they are accurate in any lighting condition (even total darkness) and produce a precise map of the surrounding area. However, due to the added cost of increased accuracy (i.e., traditional LiDAR systems are generally larger and more expensive than a typical camera), LiDAR systems are primarily used in situations where the risk of failing to accurately map an area can cause harm to people or property (e.g., a self-driving car).
Regardless of the type of sensor used (camera, LiDAR, etc.), each sensor can introduce small errors. This leads us to our final major question: How do robots fix these small errors?
Visual SLAM vs LiDAR SLAM
| Criteria | Visual SLAM | LiDAR SLAM |
|---|---|---|
| Cost | Medium | Very High |
| Accuracy | Medium | Very High |
| Lighting dependency | High | None |
| Data richness | High (images) | Moderate (point cloud) |
| Best use | AR/VR, indoor robots | Autonomous vehicles |
Example: Self-driving cars rely heavily on LiDAR SLAM for precision navigation.
Source: Stanford Autonomous Systems Lab
https://asl.stanford.edu
Where You Can Find SLAM Hiding in Plain Sight
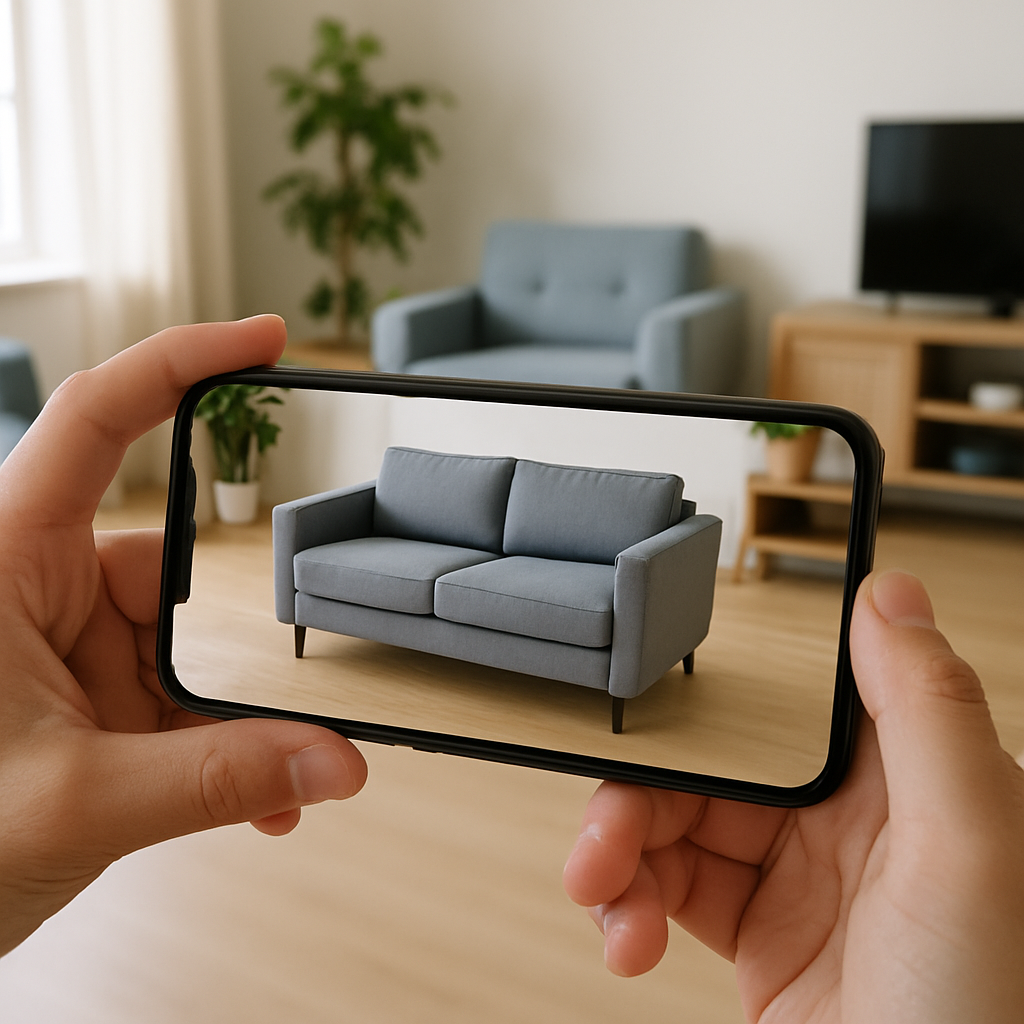
Your smartphone probably uses the same technology, SLAM, that helps you fix your own mistakes. For example, when you download a “smart” home app and use it to visualize how a new sofa fits into your living room, then you have used SLAM. Your smartphone uses a fast camera to quickly create a temporary map of your living room floors and walls, then generates a three-dimensional model of the actual space using computer vision to virtually “place” a digital sofa in the physical space.
This basic concept of SLAM will be vital to the development of transportation systems. While self-driving cars use GPS to navigate wide-open highways, the moment they enter a parking garage, tunnel, or narrow city street, GPS signals disappear. At that point, the vehicle must use SLAM to create its own map of the surroundings so it can continue to travel safely. Autonomous robots will require methods to safely navigate environments from which they cannot obtain help. One method for autonomous robots is to utilize SLAM.
While SLAM has tremendous applications here on Earth, its usefulness does extend far beyond Earth’s atmosphere. A robotic rover on Mars has no GPS system to receive signals, so it relies entirely on SLAM to navigate the Martian terrain. As the rover maps the terrain – craters and rocks – it simultaneously develops its own guidebook to the uncharted Martian terrain that humans have never had the opportunity to walk on. With each mile traveled, the rover demonstrates the capability of SLAM technology.
So, How Does a Robot Really Know Its Location?
The magic has been taken out of SLAM. A robotic system that uses SLAM no longer needs to use a map created for it. Instead, the system can generate its own map, along with its location in that map. Essentially, the system generates its own map of the area it is working in and maps its location in relation to its surroundings.
A SLAM process breaks down what would normally be an overwhelming task (mapping) into manageable pieces. When someone is trying to draw a map of a shopping center, they are simultaneously trying to determine their location on the map (the “You Are Here” icon). The true power of robots to determine their own location within their environment lies in the “aha” moment of recognizing a familiar landmark. At that point, the mental picture of the robot’s environment becomes complete, and any prior inaccuracies of the robot’s perception of its surroundings are corrected.
When you think about a robot vacuum cleaner navigating around your furniture with precision, or a rover on Mars mapping the terrain it traverses, these systems exemplify the deliberate, continuous cycle of a robot sensing its environment, moving, and revising its map. This ability of a device to sense and become aware of its spatial environment allows it to function autonomously and evolve from a mechanical device into a partner in the future of robotics, one mapped room at a time.
My Strategic Observation
Make the article a “day-in-the-life” story of one robot navigating five changing spaces, and use that single storyline to explain every SLAM concept in plain language.
Example structure: A service robot starts at its charging dock, then (1) crosses a glossy lobby where wheel slip introduces drift, (2) enters a dim hallway where the camera struggles, (3) reaches a glass-walled conference room that confuses LiDAR returns, (4) rides an elevator where GPS and landmarks disappear, and (5) returns past rearranged furniture and a crowd. At each scene, pause for a short “What SLAM is doing right now” box covering prediction vs. correction, sensor fusion (camera/LiDAR/IMU), map updates, uncertainty, and loop closure when it recognizes a familiar doorway. Add small “failure snapshots” (what goes wrong without SLAM) and “recovery moves” (slow down, rotate to re-observe, re-localize).
End with a simple takeaway table: sensor type → common failure → SLAM fix, plus a “choose your SLAM stack” checklist for indoor robots, drones, and outdoor vehicles. This framing is unique and memorable, making SLAM feel practical rather than abstract.
Conclusion
SLAM enables an industrial robot to go from simply a machine that operates to one that operates based on intent in the real world. As a result, an industrial robot can build and refine a map of an environment while simultaneously determining its location and how to move through uncharted territory, adapting to changes in the environmental layout, and remaining operational without GPS. The most prominent SLAM applications are created by integrating high-performance sensors (cameras, LIDAR, and Inertial Measurement Units (IMUs)) with sensor fusion and probabilistic methods that enable the robot to manage uncertainty rather than ignore it.
SLAM is a collection of techniques designed to be specific to a particular environment and budget constraints. Lightweight SLAM uses visual information, and LIDAR-based SLAM generates highly accurate geometric information; however, many developers also design hybrid techniques that integrate both visual and LIDAR information. Consistent, real-time map maintenance is enabled by the ability to close loops across long distances, thereby enhancing navigation, planning, and safety.
As processor power increases and sensing capabilities become more prevalent, SLAM will become less expensive, more reliable, and more widely used. Additionally, SLAM is a fundamental enabler of autonomous functionality in warehouse automation, hospital operations, delivery robots, unmanned aerial vehicles, and household appliances.
FAQs
- What does SLAM stand for, and why is it important in robotics?
SLAM means simultaneous localization and mapping. It enables a robot to determine its location and create a map of an area without prior knowledge of its layout; both are required for autonomous navigation, especially in environments such as offices or buildings where GPS performance is poor. - How do robots perform SLAM without GPS?
A robot uses data from its onboard sensors (cameras, LiDAR, wheel encoders, and/or IMU) to determine how far it has traveled and to detect “landmarks.” Measurements of motion and landmark detections from the robot’s onboard sensors are fused in real time using SLAM algorithms, enabling the algorithm to estimate the robot’s position and update the map. - What’s the difference between mapping and localization in SLAM?
The map represents the environment (walls, obstacles, landmarks, etc.). The robot’s current position and orientation within this map are determined by the localization component of SLAM. Therefore, SLAM is solving both problems simultaneously. - What is loop closure, and why does it matter?
When a robot returns to a location it has previously visited, it recognizes that it has closed a loop. Loop closures enable SLAM to correct accumulated drift (the gradual accumulation of error over time) in its maps, improving consistency and long-term navigation accuracy. - What sensors are commonly used for SLAM, and which is best?
The most common sensors used for SLAM are cameras (for visual SLAM), LiDAR (for geometry-focused SLAM), and IMU (for motion tracking). What is best depends on the specific use case. Cameras provide detailed representations but are relatively inexpensive. LiDAR provides more robust and accurate results in lower lighting conditions but is more expensive than cameras. Most commercial SLAM systems use both to increase overall reliability.

Garikapati Bullivenkaiah is a seasoned entrepreneur with a rich multidisciplinary academic foundation—including LL.B., LL.M., M.A., and M.B.A. degrees—that uniquely blend legal insight, managerial acumen, and sociocultural understanding. Driven by vision and integrity, he leads his own enterprise with a strategic mindset informed by rigorous legal training and advanced business education. His strong analytical skills, honed through legal and management disciplines, empower him to navigate complex challenges, mitigate risks, and foster growth in diverse sectors. Committed to delivering value, Garikapati’s entrepreneurial journey is characterized by innovative approaches, ethical leadership, and the ability to convert cross-domain knowledge into practical, client-focused solutions.