











Executive Summary
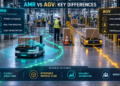
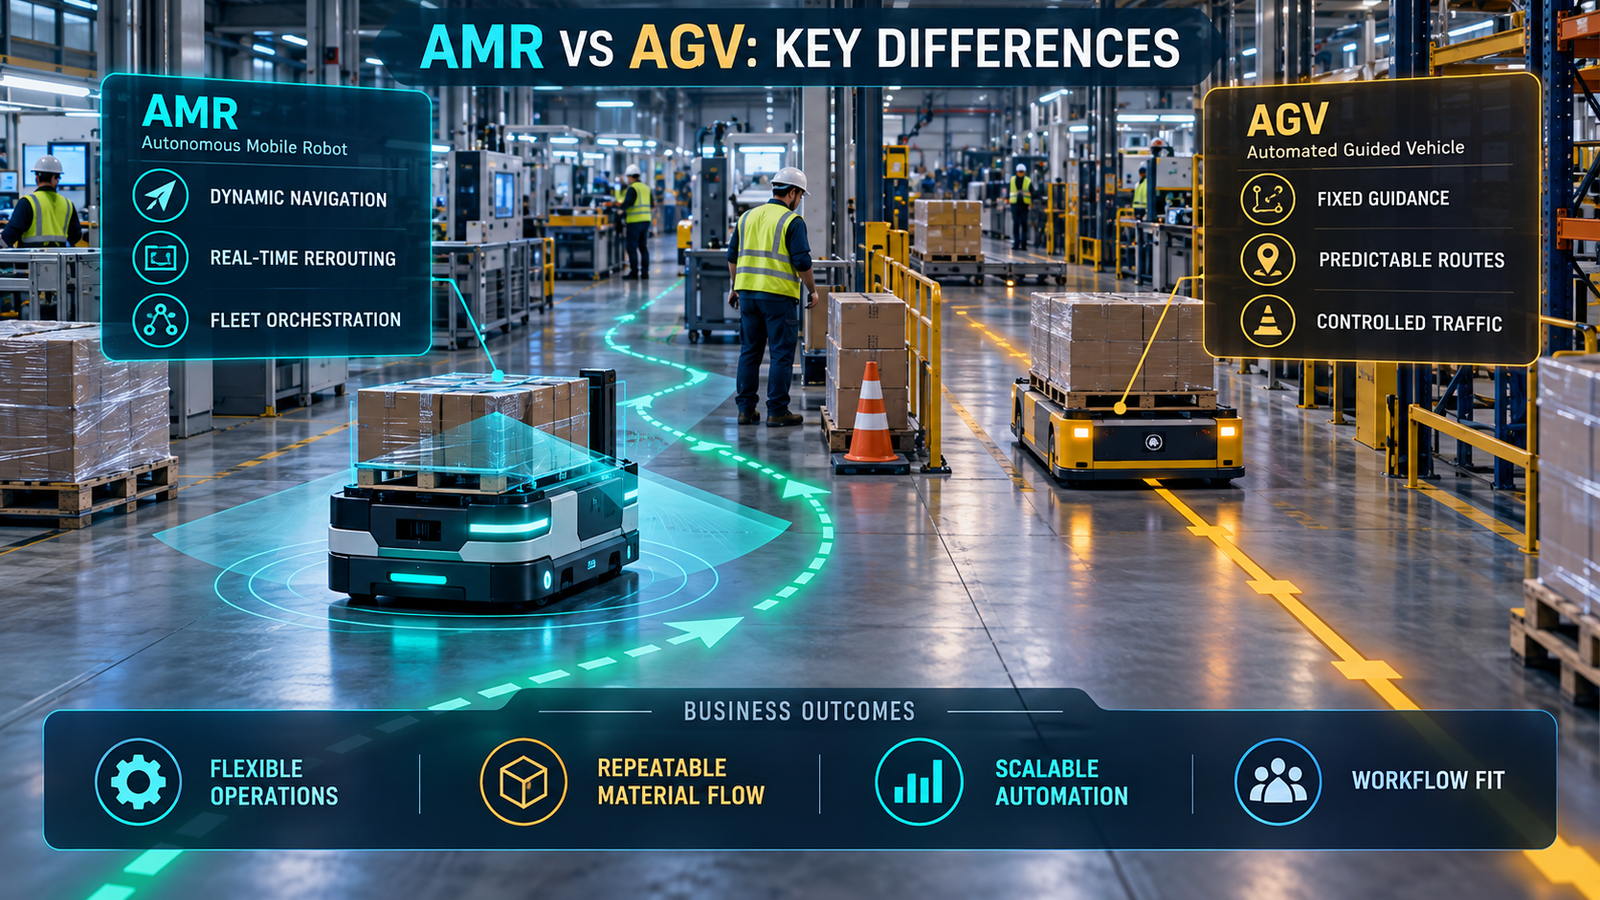
The AMR vs AGV decision is not a contest between “new” and “old” robotics. It is a capital-allocation decision about route stability, exception frequency, payload, integration effort, safety validation and the cost of operational change.
Automated guided vehicles remain effective when travel lanes, handoff points and production cadence stay predictable. Autonomous mobile robots become stronger candidates when routes change, people share the floor, tasks arrive dynamically or expansion would otherwise require repeated infrastructure work.
The crucial distinction is architectural. A conventional AGV executes movement within a tightly engineered guide-path and traffic model, while an AMR platform combines localization, mapping, obstacle detection and route planning to select a feasible path inside a permitted operating area.[1][7]
That flexibility is not free. An AMR introduces more software, wireless-network dependence, localization edge cases, fleet-orchestration complexity and cybersecurity exposure; an AGV can carry its own costs through floor modifications, fixed-path bottlenecks and expensive layout changes.
This article replaces simplistic feature claims with an evaluation method. It compares navigation, safety, throughput, enterprise integration, lifecycle cost and deployment risk, then supplies a pilot matrix, architecture overview, integration flow and governance checklist for a defensible buying decision.
I. Current Market Landscape and the Cost of a Wrong Choice
Transportation and logistics accounted for 52% of professional service-robot installations in 2024, with 102,900 units sold in that application class according to the International Federation of Robotics.[2] That scale confirms demand, but it does not prove that every facility needs maximum autonomy.
The wrong AMR vs AGV choice usually fails at the process boundary rather than at the robot. An AMR or AGV may navigate successfully yet miss production takt because docking takes too long, traffic rules create queues, wireless roaming interrupts missions or operators lack a clean exception-recovery procedure.
The Cost of Inaction
Keeping manual transport can preserve flexibility, but it also keeps travel embedded in skilled labor, makes replenishment dependent on staffing and hides queue time inside departmental budgets. The relevant baseline is not wages alone; it includes loaded labor cost, walking or driving time, injury exposure, forklift interactions, missed line-side deliveries, congestion and supervision.
OSHA notes that warehouse automation can create struck-by, caught-between and other hazards when equipment is not properly integrated.[3] That warning applies equally to a delayed project: unmanaged mixed traffic remains a risk even when the vehicle is manually driven.
The Cost of Selecting the Wrong Platform
Selecting fixed guidance for a frequently changing layout can turn every process redesign into a controls and civil-works project. Selecting autonomous navigation for an unchanging, high-volume loop may pay for perception and orchestration capabilities that do not improve output.
The financial question is therefore not “Which robot costs less?” It is “Which architecture delivers the required missions at acceptable risk over the expected life of the workflow?”
A More Accurate Market Vocabulary
Marketing labels are inconsistent, and some products sold as AGVs now use natural-feature navigation. ISO 3691-4 treats automated guided vehicles and autonomous mobile robots as examples of driverless industrial trucks, so purchasers should contract against verified behavior and safety functions rather than the label on a brochure.[1]
For this article, “AGV” means a vehicle whose operational freedom is constrained primarily by predefined guide-paths or tightly controlled routes. “AMR” means a vehicle that localizes within a map, perceives obstacles and computes or selects alternate routes inside defined constraints.
II. AMR vs AGV Technical Analysis and Evidence
Architecture Overview
The AMR vs AGV architecture gap begins at localization and expands through dispatch, traffic control and recovery. Both platforms need motion control, braking, safety-rated sensing, battery management and a supervisory system, but they allocate intelligence differently.
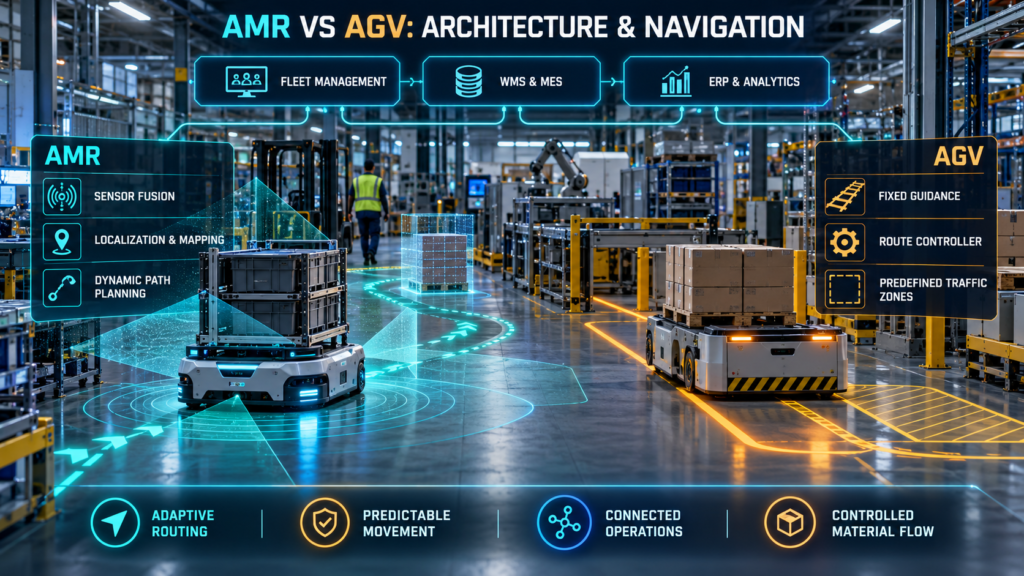
AMR Functional Stack
- Safety scanners and perception sensors detect people, vehicles, racks and unexpected obstacles.
- Localization estimates the robot’s position from LiDAR, cameras, encoders, inertial sensing or mapped features.
- A planner selects a route through permitted space and replans when the original path is blocked.
- Fleet software assigns missions, resolves shared-resource conflicts and manages charging.
- Connectors exchange tasks and confirmations with WMS, MES, ERP or manufacturing applications.
Academic reviews describe AMR navigation as a combination of sensing, sensor fusion, localization, mapping, path planning and obstacle avoidance.[7][8] Each additional capability increases adaptability while creating more parameters, failure modes and test cases.
AGV Functional Stack
- Guidance follows wire, magnetic tape, markers, reflectors or a predetermined natural-feature route.
- Local controls maintain the commanded path, speed profile and stopping behavior.
- Zone or traffic controllers release vehicles into intersections and shared segments.
- PLC or fleet logic dispatches repeatable moves between known stations.
- Enterprise connectors translate production requests into route and station commands.
Automated guided vehicle systems can be sophisticated, especially when they include laser localization, automated forklifts and enterprise middleware. Their commercial value often comes from repeatability and deterministic traffic behavior, not from broad path freedom.
Autonomous Mobile Robots: A Powerful, Practical ROI Guide for Industry 4.0 a
Integration Flowchart
The practical data flow should be designed before a vendor demonstration:
```mermaid
flowchart TD
    A[WMS, MES or ERP task] --> B[Orchestration and validation]
    B --> C[Fleet manager]
    C --> D[AMR or AGV mission]
    D --> E[PLC, door, lift or station handshake]
    E --> F[Completion and exception event]
    F --> A
```
The enterprise system should own the business requirement, while the fleet layer owns vehicle assignment and traffic execution. Directly coupling every robot to ERP logic makes upgrades fragile and complicates auditability.
Navigation: Fixed Guidance Versus Dynamic Planning
An AGV performs best when its route is an engineered asset. That route can be validated once, protected from interference and optimized around predictable intersections, but a blockage may stop the mission until the path is cleared.
An AMR treats the route as a computed decision inside a controlled map. The AMR can move around a temporary obstruction when another safe path exists, but replanning may produce variable travel time and must never bypass safety zones or process restrictions.
Navigation Edge Cases That Demonstrations Often Miss
- Reflective film, glass and polished metal can complicate perception.
- Repetitive racks or long feature-poor corridors can weaken localization.
- Pallets protruding above or below a scanner plane can create blind geometry.
- Dust, condensation and changing sunlight can affect optical sensors.
- Map changes can invalidate docking references or narrow safety clearances.
- Dense traffic can turn individually efficient routes into fleet-level congestion.
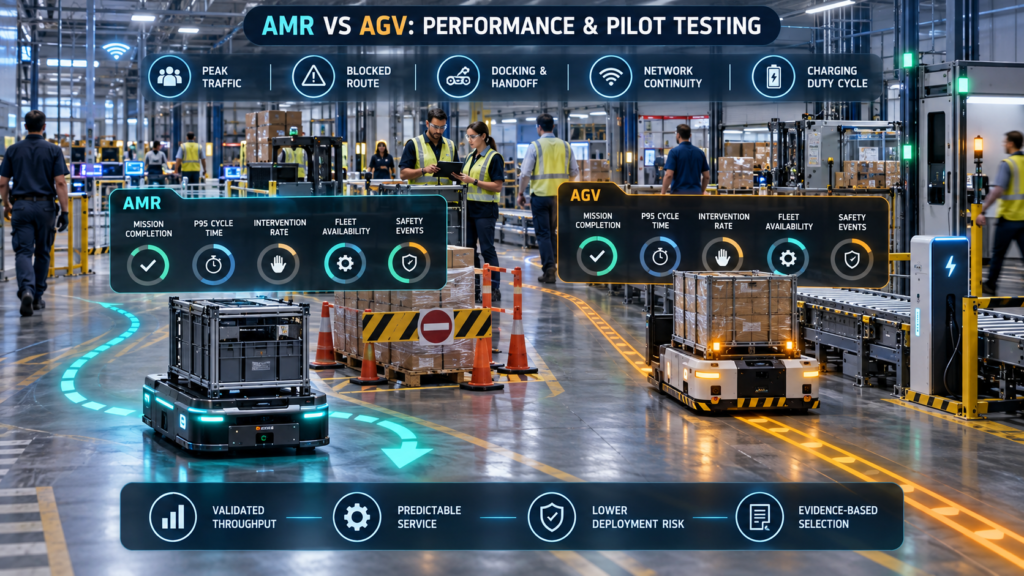
The AMR vs AGV decision should therefore use the worst credible operating hour, not a clean demonstration route. A pilot must include blocked aisles, peak pedestrian movement, doors, lifts, radio handoffs and realistic payload overhang.
Throughput Is a System Property
Use this formula as an initial average-capacity estimate:
Estimated vehicle count = missions per hour × average vehicle cycle time in minutes ÷ (60 × planned utilization).
Enter planned utilization as a decimal, such as 0.80 for 80%, and round the result up to a whole vehicle. Cycle time should include loaded travel, empty repositioning, pickup, handoff and mission-related waiting. Allow for charging, maintenance and recovery through the utilization assumption without counting the same allowance twice.
This estimate does not establish the final production fleet. Validate peak demand, variation in cycle times, traffic congestion, station capacity, charger availability and vehicle outages through simulation and representative pilot testing.
Performance Evaluation Matrix
| Metric | Measurement Method | Why It Matters | Pilot Acceptance Rule |
|---|---|---|---|
| Mission completion rate | Completed missions ÷ dispatched missions | Exposes navigation, handoff and process failures | Set from the business service level before testing |
| P50/P95 cycle time | Dispatch-to-confirmation timestamps | Separates typical performance from tail delays | P50 and P95 must meet agreed cycle-time thresholds; review maximum delays and failed missions separately. |
| Intervention rate | Human recoveries per 100 missions | Converts “autonomy” into support workload | Include remote and floor interventions |
| Docking success | First-attempt handshakes ÷ attempts | Protects conveyor, pallet and machine interfaces | Validate with realistic load variation |
| Blocked-path recovery | Successful alternate-route or safe-stop events | Tests operational resilience | No unsafe workaround or uncontrolled deadlock |
| Fleet availability | Available operating time ÷ scheduled time | Reveals charging and maintenance effects | Measure across full shifts, not a demo hour |
| Network continuity | Mission behavior during roaming and outage tests | Exposes infrastructure dependence | Safe degraded state plus controlled recovery |
| Near-miss and stop events | Safety log review with location context | Identifies layout and behavior problems | Investigate patterns, not merely totals |
The matrix prevents a weak AMR vs AGV comparison based on top speed or payload alone. Acceptance thresholds should reflect the actual production service level and be agreed before the pilot begins.
III. Feature, Cost and Deployment Comparison
AMR vs AGV Decision Table
| Decision Factor | AMR | AGV | Commercial Implication |
|---|---|---|---|
| Route model | Dynamic path selection within mapped constraints | Predefined guide-path or tightly controlled route | AMR favors change; AGV favors repeatability |
| Facility preparation | Mapping, traffic rules, docking and network validation | Guide-path, markers, reflectors or route engineering | Compare real site work, not robot price alone |
| Obstacle response | Stop, wait or replan when a validated alternative exists | Usually stop or follow predefined bypass logic | AMR can reduce blockage time but adds validation cases |
| Cycle-time variance | Can vary with congestion and replanning | More deterministic on protected routes | AGV may suit takt-sensitive fixed loops |
| Layout changes | Usually software/map reconfiguration plus validation | May require guide-path and controls changes | Change frequency drives lifecycle economics |
| Wireless dependence | Often high for dispatch and fleet optimization | Varies; some local route control is less dependent | Test roaming, latency and safe degraded operation |
| Fleet orchestration | Dynamic assignment and traffic coordination | Route/zone dispatch and intersection control | Both need congestion engineering at scale |
| Integration effort | API, middleware, events and map/process alignment | PLC, station, route and enterprise handshakes | Neither is “plug and play” in a live plant |
| Cyber exposure | Larger software and connectivity surface | Often narrower, but still networked and updateable | Apply risk controls to both platforms |
| Best fit | Variable missions and changing environments | Stable, repetitive point-to-point flow | Hybrid fleets may be commercially rational |
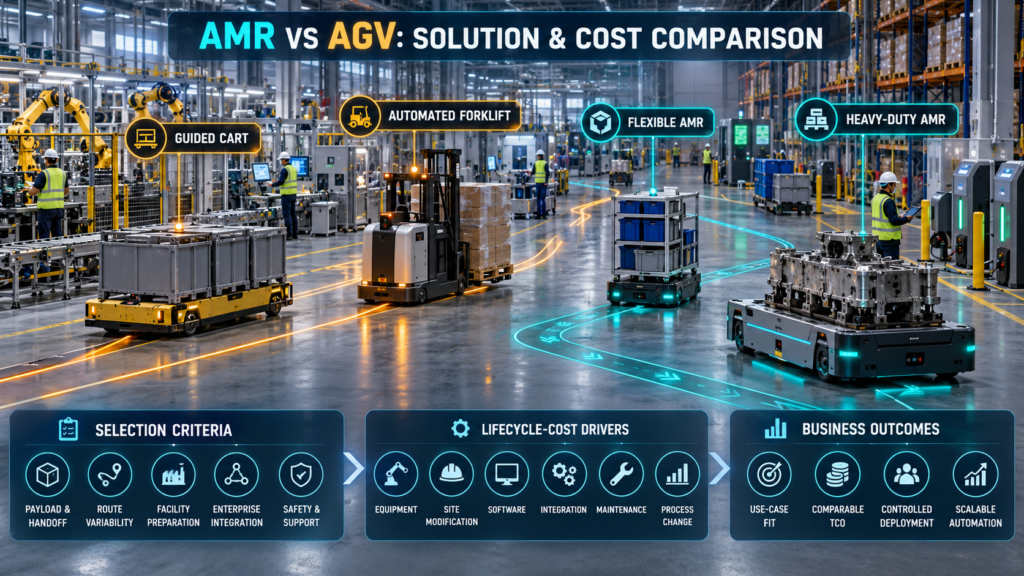
Representative Market Solutions and Cost Drivers
Public list prices are rarely meaningful because vehicles, attachments, chargers, safety engineering, software, integration and support are quoted as systems. The comparison below uses currently published product positioning and specifications; all capabilities must be reconfirmed in a request for proposal.[10][11][12][13]
| Representative Solution | Category and Published Capacity | Best-Fit Work | Major Cost Drivers | Procurement Caution |
|---|---|---|---|---|
| Toyota Mouse/Mole AGC | Fixed-route automated guided cart | Repetitive tugging between stable production points | Carts, guide-path, stations, charging and controls | Entry price can hide route-change and station work |
| Toyota automated guided forklift | Automated pallet handling | Stable pallet pickup, transport and rack interfaces | Vehicle, safety design, middleware, rack tolerances | Validate pallet condition, fork entry and mixed traffic |
| MiR250 | Flexible AMR; vendor specifies up to 250 kg payload | Totes, carts and small/medium internal transport | Top module, fleet software, Wi-Fi, integration and support | Payload module changes usable capacity and geometry |
| OTTO 1500 | Heavy-duty AMR; vendor specifies up to 1,900 kg | Heavy material transport in dynamic factories | Vehicle, attachments, charging, fleet system and site integration | Vendor performance claims require site-specific validation |
This is not a ranking. It illustrates why AMR vs AGV procurement must start with the load, interface and workflow rather than an AMR brand shortlist.
Total Cost of Ownership Model
Compare both alternatives over the same ownership period. Include equipment, site preparation, integration, software, support, energy, operational changes and downtime costs, then subtract the expected residual value.
Undiscounted TCO = total costs over the ownership period − residual value.
For a discounted comparison, convert each future cost and the residual value to present value using the same discount rate and cash-flow timing for both alternatives. Keep upfront costs separate from recurring costs and avoid counting an expense in more than one category.
Equipment includes robots, batteries, chargers, attachments and spares. Site cost includes floor work, guide-paths, markers, network coverage, guarding, doors, lifts and workstation changes.
Integration includes WMS/MES/ERP interfaces, PLC handshakes, identity management, event logging and testing. Change cost includes remapping, route modification, software regression, retraining and renewed safety validation over the system life.
Autonomous Mobile Robot Cost Questions
- Is fleet-management licensing perpetual, subscription-based or usage-based?
- Which APIs are included, rate-limited or separately licensed?
- Does the quote include maps, simulation, traffic tuning and failover testing?
- Are batteries and chargers sized for peak duty cycle or average use?
- Who pays for wireless surveys, coverage remediation and roaming tests?
- What response time, spare-parts stock and software support are contracted?
AGV Cost Questions
- Does installation include tape, wire, reflectors, floor repair and protection?
- How much does a route or station change cost after acceptance?
- Can the controller expand without a platform replacement?
- How are intersections, fire doors, lifts and manual vehicles coordinated?
- What production downtime is required for installation and future changes?
- Which safety and controls modifications fall outside the vehicle quotation?
ROI Without Marketing Arithmetic
Calculate financial benefits from verified changes in expenditure or additional contribution margin. Released employee hours are an operational benefit, but become cash savings only when staffing, overtime, agency expenditure or planned hiring actually changes. Record additional contribution margin only where increased throughput produces verified additional sales after associated variable costs.
Annual net cash benefit = verified annual cash savings + additional annual contribution margin − incremental annual operating costs.
Simple payback in years = initial deployed investment ÷ positive annual net cash benefit.
Count each benefit once and use the same currency and annual reporting period throughout. This payback calculation assumes a reasonably stable annual net cash benefit.
Simple payback is easy to communicate but ignores the timing of cash flows. For large fleets, use net present value and scenario analysis for volume, uptime, labor cost, layout changes and residual value.
IV. Commercial Solutions and Deployment Best Practices
Start With a Mission Catalogue
List every candidate move with origin, destination, load, frequency, service window, peak demand, loading method and exception path. A mission catalogue exposes whether a proposed platform solves one attractive route or a reusable family of workflows.
For each mission, record human and vehicle traffic, aisle width, floor condition, slopes, doors, lifts, temperature, dust, lighting, radio coverage and emergency access. These facts determine AMR engineering effort more reliably than a generic warehouse automation solutions presentation.
Use a Weighted Decision Model
Score each architecture against business-specific weights rather than assigning equal importance to every feature. A regulated plant may weight traceability and change control heavily, while a high-mix warehouse may prioritize route flexibility and seasonal scaling.
| Criterion | Example Weight | Evidence Required |
|---|---|---|
| Throughput at P95 demand | 20% | Pilot logs and simulation assumptions |
| Safety and compliance | 20% | Risk assessment, test evidence and certificates |
| Workflow adaptability | 15% | Demonstrated route and mission change procedure |
| Integration fit | 15% | API, PLC and event-contract proof |
| Five-year TCO | 15% | Itemized costs with change scenarios |
| Reliability and support | 10% | SLA, spares, escalation and reference sites |
| Cybersecurity | 5% | Architecture, patching, access and logging evidence |
Weights are examples, not universal recommendations. The procurement team should approve them before seeing vendor scores to reduce selection bias.
Deployment Challenges
Brownfield Geometry
Older facilities contain patched floors, temporary storage, narrow turns and informal pedestrian shortcuts. Survey the live operating envelope, including payload overhang and stopping distance, rather than trusting a static CAD plan.
Mixed Traffic
Forklifts, pallet jacks and people behave less predictably than robots. A technically safe AMR that stops for every intrusion can still miss takt, while a fixed-route AGV lane can become an operational barrier if crossings are badly placed.
Wireless and Edge Failure
Document what happens when Wi-Fi is congested, authentication expires, the fleet manager restarts or a time source drifts. Safe stopping is essential, but recovery time and mission reconciliation determine the business impact.
Charging Strategy
Opportunity charging can reduce battery swaps but creates contention if chargers are undersized or badly located. Model travel to charging, queue time, battery aging and degraded capacity at end of life.
Change Management
Operators need clear rules for blocked paths, damaged loads, manual recovery, emergency stops and restarting equipment. A deployment is not accepted until frontline staff can resolve expected exceptions without bypassing safeguards.
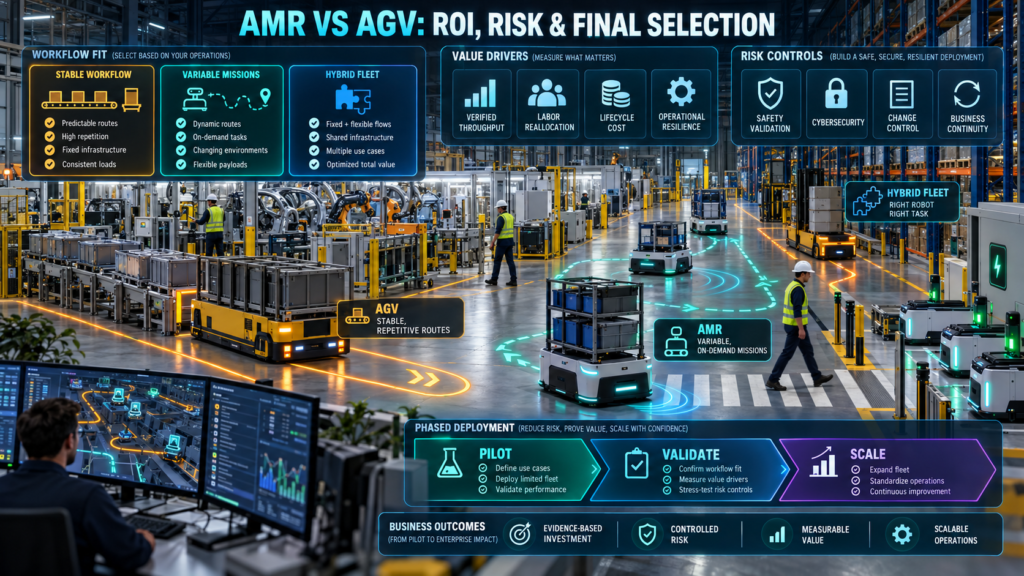
When a Hybrid Fleet Is Better
A hybrid design can reserve AGVs for stable milk runs and deploy each AMR for on-demand replenishment, exceptions and variable routes. The approach is attractive only when traffic rules, right-of-way, interfaces and fleet visibility work across platforms.
MassRobotics developed an interoperability standard to support information sharing and coexistence among mobile robots from different vendors.[6] Interoperability data can improve situational awareness, but it does not automatically create unified task allocation, safety certification or cross-vendor optimization.
V. Business Outcomes and Strategic ROI Takeaways
The best AMR vs AGV result is a controlled material-flow service, not the maximum number of robots. Executives should require stable mission completion, predictable tail latency, accountable exceptions and auditable cost before authorizing scale.
Where AGVs Usually Win
AGVs are strong when the route is stable, the load and handoff are standardized, cycle time must be repeatable and facility changes are rare. A protected loop can deliver dependable performance with simpler operational behavior.
Where AMRs Usually Win
An AMR is strong when tasks are dispatched dynamically, layouts or destinations change, alternate paths exist and mixed traffic makes fixed infrastructure inconvenient. AMR value comes from reducing the cost and delay of change, not merely from avoiding magnetic tape.
Where Both Can Lose
Both platforms lose when the underlying process is unstable, loads are inconsistent, handoff stations lack tolerances or the enterprise system sends incomplete tasks. Automation can accelerate a good process, but it can also industrialize poor master data and exception handling.
Board-Level ROI Questions
- Which verified cost or capacity constraint does the project remove?
- What volume and uptime assumptions drive the business case?
- What happens to value if demand falls, labor cost changes or the layout moves?
- Which benefits appear in financial statements, and which remain operational?
- Who owns benefit realization after technical acceptance?
- What exit path exists if the vendor, software or integration partner changes?
VI. Risk Mitigation and Regulatory Framework
ISO 3691-4:2023 specifies safety requirements and verification methods for driverless industrial trucks, including vehicles described as AGVs and AMRs.[1] It should inform the safety program, but site responsibility still includes the complete application, traffic environment, interfaces and operating procedures.
OSHA requires employers to address recognized workplace hazards, and its warehousing guidance specifically warns that poorly integrated automation can create struck-by and caught-between risks.[3][4] Compliance cannot be delegated entirely to a robot certificate.
Safety and Compliance Checklist
- Complete a documented application and site risk assessment.
- Define operating, restricted, pedestrian and emergency-access zones.
- Validate protective fields, speed limits, braking and stopping behavior.
- Test payload overhang, dropped loads and sensor occlusion.
- Verify doors, lifts, conveyors, PLCs and station interlocks.
- Establish lockout/tagout and maintenance isolation procedures.
- Train operators, maintenance staff, contractors and emergency responders.
- Control maps, routes, firmware, safety parameters and approval records.
- Investigate stop events and near misses by location and scenario.
- Revalidate after material changes to layout, load, speed or software.
Cybersecurity Checklist Based on NIST CSF 2.0
NIST’s manufacturing profile applies cybersecurity risk management to components including PLCs, sensors, actuators, robots, firmware and network infrastructure.[5] For mobile robot fleet management, translate its Govern, Identify, Protect, Detect, Respond and Recover functions into concrete controls.
- Maintain an inventory of robots, chargers, controllers, gateways and software versions.
- Segment robot networks from general corporate and guest traffic.
- Use unique identities, least privilege and strong administrator authentication.
- Encrypt supported management and application traffic.
- Define signed-update, patch-testing and vulnerability-response procedures.
- Centralize logs for authentication, configuration, mission and safety events.
- Back up maps, configurations, certificates and integration settings.
- Test loss of network, fleet manager and upstream application services.
- Document manual fallback and safe recovery from ransomware or outage.
- Include vendors and integrators in incident notification obligations.
EU Machinery and AI Considerations
Regulation (EU) 2023/1230 expressly addresses autonomous mobile machinery and replaces the Machinery Directive on its application date.[9] Organizations placing systems on the EU market should obtain product-specific legal advice, conformity documentation and a clear allocation of manufacturer, integrator and operator duties.
The EU AI Act may apply to an AI component depending on its intended purpose and regulatory classification, but not every navigation algorithm is automatically a high-risk AI system. Treat applicability as a documented legal assessment rather than a marketing checkbox.
Risk Register for the Final AMR vs AGV Decision
| Risk | AMR Exposure | AGV Exposure | Core Mitigation |
|---|---|---|---|
| Localization or guidance loss | Map/sensor degradation | Damaged tape, wire, marker or reflector | Detection, safe state, inspection and recovery SOP |
| Congestion and deadlock | Dynamic route interaction | Shared-segment and intersection queues | Simulation, traffic rules and peak pilot |
| Network outage | Fleet coordination degradation | Dispatch/control impact varies by design | Segmentation, redundancy and degraded-mode testing |
| Unsafe configuration change | Map, speed or software change | Route, PLC or zone change | Access control, versioning and revalidation |
| Vendor lock-in | Fleet API and map formats | Proprietary controller and guide-path logic | Data rights, interface terms and exit plan |
| Unplanned downtime | Software, sensor or battery failure | Vehicle, controller or guide-path failure | Spares, SLA, preventive maintenance and fallback |
VII. Procurement Decision and Evaluation Plan
Choose an AGV when the workflow is stable, traffic can be engineered, deterministic movement has high value and expected layout changes are limited. Choose an AMR when route variability, on-demand work and process change justify the added AMR software and validation burden.
Choose a hybrid system when the mission catalogue contains both stable loops and variable tasks, and when the organization can govern multi-vendor traffic and interfaces. Do not select a hybrid fleet merely to postpone an architectural decision.
Illustrative Twelve-Week Evaluation Plan
This schedule is illustrative. Extend the baseline, design or pilot stages where necessary to capture representative demand cycles, obtain equipment, complete integration and validate safety.
- Weeks 1–2 — Baseline: Measure mission demand, cycle-time distribution, travel labor, exceptions and current safety events.
- Weeks 3–4 — Design: Freeze the use case, payload, interfaces, acceptance metrics and weighted selection model.
- Weeks 5–8 — Pilot: Run peak traffic, obstructions, network loss, charging, docking and recovery scenarios.
- Weeks 9–10 — Validate: Reconcile system logs with manual observations and calculate scenario-based TCO.
- Weeks 11–12 — Decide: Approve, redesign or stop using evidence captured against predetermined thresholds.
Before requesting supplier proposals, prepare a mission catalogue, wireless and traffic survey, safety concept, enterprise integration requirements, pilot acceptance matrix and five-year TCO model. Require every shortlisted supplier to price the same scope so quotations remain comparable.
Frequently Asked Questions
Is an AMR always better than an AGV?
No. An AMR provides greater route adaptability, but a fixed-route AGV can be simpler and more predictable for a stable, repetitive loop.
Which option has the lower upfront cost?
The answer depends on payload, vehicle type, guidance infrastructure, attachments, safety engineering and integration. Compare deployed system cost, not the vehicle quotation.
Can AMRs and AGVs operate together?
Yes, but shared traffic rules, right-of-way, interoperability data, emergency behavior and operational ownership must be engineered. Coexistence does not automatically create coordinated optimization.
Do AMRs require Wi-Fi?
Most commercial fleets use wireless connectivity for dispatch, telemetry and coordination, though onboard safety and motion functions should enter a defined safe state when communications fail. Test the specific product’s degraded behavior.
How should ROI be validated?
Use baseline data, full-cycle timestamps, intervention records and verified financial assumptions. Measure the pilot under representative demand before extrapolating to a full fleet.
Appendix A: Academic and Primary-Source Footnotes
- International Organization for Standardization, ISO 3691-4:2023 — Industrial Trucks: Safety Requirements and Verification, Part 4: Driverless Industrial Trucks and Their Systems. https://www.iso.org/standard/83545.html
- International Federation of Robotics, World Robotics 2025 — Service Robots: Executive Summary. https://ifr.org/img/worldrobotics/Executive_Summary_WR_2025_Service_Robots.pdf
- U.S. Occupational Safety and Health Administration, Warehousing: Hazards and Solutions. https://www.osha.gov/warehousing/hazards-solutions
- U.S. Occupational Safety and Health Administration, Robotics Overview. https://www.osha.gov/robotics
- National Institute of Standards and Technology, Cybersecurity Framework 2.0 Manufacturing Profile, NIST IR 8183 Rev. 2, Initial Public Draft. https://nvlpubs.nist.gov/nistpubs/ir/2025/NIST.IR.8183r2.ipd.pdf
- MassRobotics, AMR Interoperability Working Group. https://www.massrobotics.org/working-groups/
- Russell Keith and Hung Manh La, Review of Autonomous Mobile Robots for the Warehouse Environment, arXiv:2406.08333, 2024. https://arxiv.org/abs/2406.08333
- Saeid Nahavandi et al., A Comprehensive Review on Autonomous Navigation, arXiv:2212.12808, 2022. https://arxiv.org/abs/2212.12808
- European Union, Regulation (EU) 2023/1230 on Machinery. https://eur-lex.europa.eu/eli/reg/2023/1230/oj/eng
- Toyota Material Handling, Mouse and Mole Automated Guided Carts. https://www.toyotaforklift.com/lifts/automated-guided-vehicles/mouse-and-mole-automated-guided-carts
- Toyota Material Handling, Automated Guided Vehicle FAQ. https://www.toyotaforklift.com/resource-library/blog/automation-solutions/automated-guided-vehicle-faq
- Mobile Industrial Robots, MiR250 Specifications. https://mobile-industrial-robots.com/products/robots/mir250/specifications
- OTTO by Rockwell Automation, OTTO 1500 Data Sheet and Product Information. https://ottomotors.com/resources/downloads/1500-data-sheet/
- Aniruddha Singhal et al., Managing a Fleet of Autonomous Mobile Robots Using Cloud Robotics Platform, arXiv:1706.08931, 2017. https://arxiv.org/abs/1706.08931
- Marius Merschformann, Lin Xie and Daniel Erdmann, Path Planning for Robotic Mobile Fulfillment Systems, arXiv:1706.09347, 2017. https://arxiv.org/abs/1706.09347
Appendix B: Research Integrity and Editorial Transparency
Corporate Editorial Transparency and AI Usage Disclosure
This article was restructured and language-edited with AI assistance under human editorial direction. Claims, standards, market figures and product specifications were checked against the primary or academic sources listed in Appendix A; AI output should not replace engineering, safety, cybersecurity, procurement, financial or legal review.
Vendor specifications and positioning are identified as vendor-reported information. Product availability, software features, pricing, standards and regulatory requirements may change, so the publisher should reverify time-sensitive claims before publication and during scheduled updates.
Author and Editorial Review
Author: Garikapati Bullivenkaiah
Technology research writer with LL.B., LL.M., M.A., and MBA qualifications. He writes about emerging technologies and their business, governance and legal implications. His multidisciplinary academic background informs his analysis of technology adoption, intellectual property, and organizational risk. His articles explain technical concepts and practical considerations for business owners, IT managers and technology decision-makers. LinkedIn Profile
Reviewed by: Chitikineni Ramadevi — Editor
Chitikineni Ramadevi holds an M.Sc. in Computers from Andhra University and has over 10 years of research experience in technology-related subjects. She reviews NezzHub articles for clarity, factual accuracy, source support and practical relevance.
Published by: NezzHub
Research approach: This article draws on primary sources, technical documentation and relevant industry research. References are provided within the article or its sources section.
Last reviewed: 09-26-2026
Corrections: To report a factual error or outdated information, please contact NezzHub.

Garikapati Bullivenkaiah is a seasoned entrepreneur with a rich multidisciplinary academic foundation—including LL.B., LL.M., M.A., and M.B.A. degrees—that uniquely blend legal insight, managerial acumen, and sociocultural understanding. Driven by vision and integrity, he leads his own enterprise with a strategic mindset informed by rigorous legal training and advanced business education. His strong analytical skills, honed through legal and management disciplines, empower him to navigate complex challenges, mitigate risks, and foster growth in diverse sectors. Committed to delivering value, Garikapati’s entrepreneurial journey is characterized by innovative approaches, ethical leadership, and the ability to convert cross-domain knowledge into practical, client-focused solutions.