

















Executive Summary
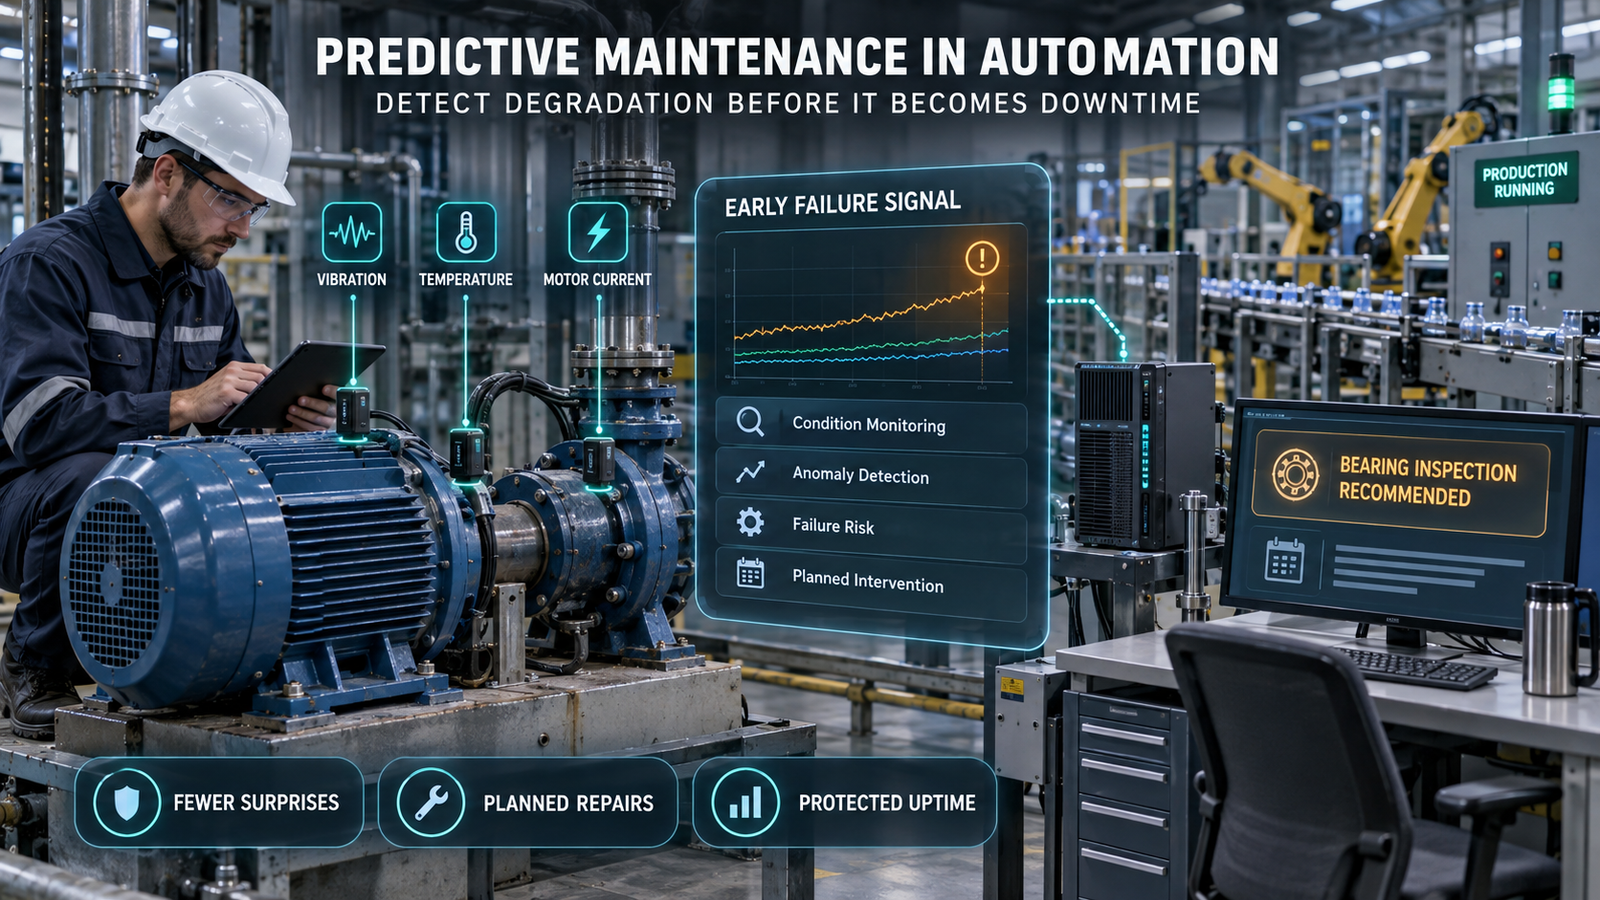
Predictive maintenance uses equipment condition data to estimate degradation or failure risk early enough for a planned intervention. The commercial goal is not perfect foresight; it is fewer costly surprises without replacing healthy components simply because a calendar says they are due.
Predictive maintenance works only when sensing, asset context, analytics and maintenance execution operate as one system. A vibration alert that never reaches the correct work order is an expensive dashboard, not an operational capability.
Modern predictive maintenance architectures combine industrial IoT sensors, programmable controllers, edge gateways, historians, feature pipelines, condition rules, machine-learning models and computerized maintenance management systems. Each link creates its own latency, data-quality and cybersecurity trade-offs.
The strongest predictive maintenance use cases involve critical rotating assets with measurable failure signatures and enough lead time to act. Bearings, motors, pumps, fans, gearboxes and compressors often fit that profile, while inexpensive noncritical components may still be cheaper to run to failure.
Claims of universal 30%, 50% or 60% downtime reduction are not credible without a named plant, baseline, observation window and calculation method. This paper replaces those headline promises with a field-verification matrix and a transparent ROI model.
The recommended deployment path is a bounded pilot across one asset family. Establish failure modes, instrument consistently, operate in shadow mode, measure false alarms and missed failures, then integrate only accepted alerts into the CMMS.
I. The Current Market Landscape and Challenge
Predictive maintenance is a decision system, not a sensor purchase
Plants already collect large volumes of automation data. The predictive maintenance gap is converting those signals into a decision that arrives with enough warning, confidence and operational context to justify action.
Condition data alone cannot determine business priority. A modest anomaly on a bottleneck compressor with a 20-week spare-parts lead time may matter more than a severe anomaly on a redundant fan held in stores.
This is why predictive maintenance software must connect technical risk with asset criticality, production schedules, parts availability and safety consequences. Without that context, predictive maintenance ranks signal novelty rather than operational exposure.
Reactive, preventive and condition-based strategies must coexist
Run-to-failure is rational for low-cost, noncritical and easily replaced items. Calendar-based preventive work is appropriate where regulations, warranties or known wear intervals require service regardless of measured condition.
Condition-based maintenance triggers work after a measured threshold or inspection result. Predictive maintenance goes further by estimating future risk or remaining useful life, but the distinction is often blurred in vendor marketing.
Reliability-centered maintenance chooses among these strategies by failure mode. It does not force every asset into the most technically sophisticated category.
The cost of inaction
Unplanned failure can create lost throughput, scrap, expedited freight, secondary equipment damage, overtime and missed customer commitments. The financial effect depends on the constrained production resource, not merely the repair invoice.
Maintenance teams also lose planning efficiency when emergencies displace scheduled work. Parts are ordered at premium speed, specialists are called outside normal shifts and planned shutdown scopes become unstable.
The strongest business case quantifies this complete event cost. Predictive maintenance should be compared against the probability-weighted loss it can realistically influence, not against total plant revenue.
The cost of premature automation
Over-instrumenting noncritical assets can produce more signals than the team can investigate. False positives create unnecessary inspections, while false negatives create misplaced confidence.
Poorly mounted sensors, changed operating speeds and missing work-order feedback can degrade models without an obvious software error. The plant may keep paying licenses and cloud charges while technicians quietly ignore alerts.
Predictive maintenance can therefore add operational debt. A pilot must prove that the organization can maintain the sensors, data pipeline, model and response process for the life of the asset.
How Cloud AI Powers Robots and Automation Systems
II. Deep-Dive Technical Analysis and Evidence
Architecture Overview: how predictive maintenance reaches a work order
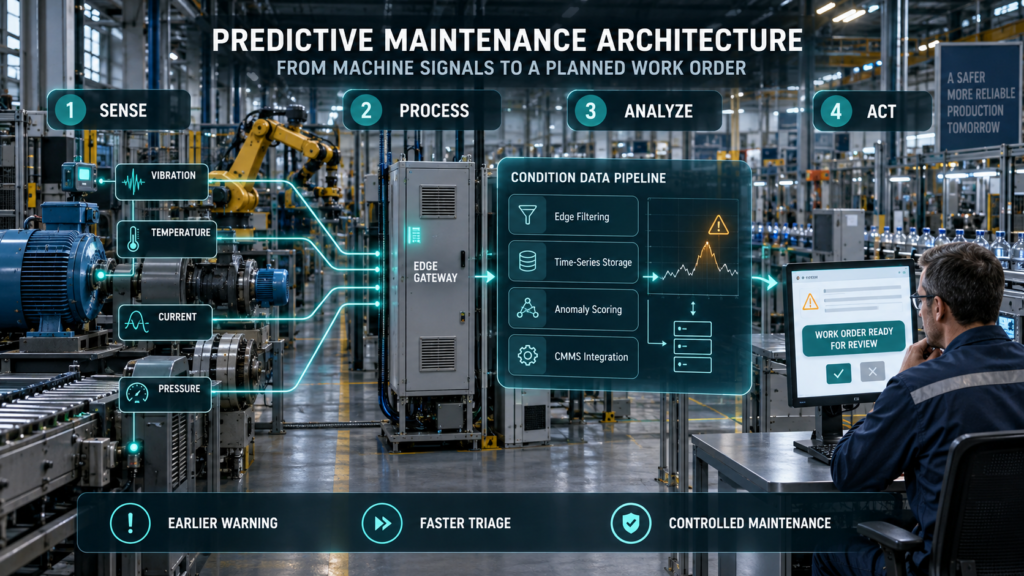
A production predictive maintenance design has at least nine layers. Treating the analytics model as the entire solution hides most implementation failures.
- Physical asset: Motor, bearing, pump, gearbox, robot, compressor or process equipment.
- Sensing: Vibration, temperature, current, pressure, acoustics, oil condition, speed or process variables.
- Acquisition: PLC, data-acquisition unit, protection relay or condition-monitoring device.
- Edge processing: Filtering, resampling, FFT calculation, compression and local thresholding.
- Transport: OPC UA, MQTT, vendor protocols or historian interfaces.
- Data platform: Time-series storage, asset hierarchy, event context and retention.
- Analytics: Rules, anomaly detection, diagnosis, probability estimation or remaining-useful-life models.
- Decision layer: Criticality, confidence, lead time, parts and production constraints.
- Execution: CMMS notification, inspection, work order, technician finding and model feedback.
The predictive maintenance system is only as strong as the asset identity connecting these layers. A sensor tag that does not map reliably to the CMMS asset, location and failure history breaks the learning loop.
Integration Flowchart
- Collect machine-condition signals from the selected sensors.
- Process readings through a PLC or edge gateway.
- Combine the readings with historian records and asset context.
- Evaluate the data using engineering rules and validated condition models.
- Continue monitoring when no actionable concern is identified.
- Request technician inspection when evidence is uncertain or needs confirmation.
- Submit high-priority findings for maintenance planning and approval.
- Record inspection findings, corrective actions and failure codes.
- Use verified findings to review thresholds and model performance before deploying changes.
The predictive maintenance feedback path is not optional. Technician findings turn an alert into labeled field evidence and reveal whether the model identified a real failure mode.
Sensor selection begins with the failure mode
Vibration monitoring is effective for many rotating-equipment faults, including imbalance, misalignment, looseness and bearing defects. Sampling frequency, mounting, sensor orientation and machine speed determine whether the signal is usable.
Temperature is cheaper to collect but often changes later in the degradation process. A hot bearing can confirm distress, yet vibration may provide earlier diagnostic information for some faults.
Motor-current signature analysis can detect electrical and mechanical effects without mounting a sensor directly on every component. Interpretation becomes difficult when variable-frequency drives, load changes and process transients alter the spectrum.
Oil analysis can reveal wear particles, contamination and lubricant breakdown. It is valuable for gearboxes and lubricated systems, but sampling procedure and laboratory turnaround affect reliability and lead time.
Predictive maintenance should combine signals only when each adds decision value. Adding channels increases hardware, networking, storage, calibration and analysis cost.
Sampling and edge-compute trade-offs
High-frequency vibration data can be too large and latency-sensitive to stream continuously from every asset. Edge devices commonly calculate spectra, envelope features, crest factor, kurtosis or band energy before sending summaries upstream.
Feature extraction lowers bandwidth and storage but can discard evidence needed for later diagnosis. A hybrid design retains triggered raw waveforms around anomalies while transmitting compact health indicators routinely.
Predictive maintenance models need accurate operating context. Speed, load, recipe, ambient temperature and machine state can explain a signal change that otherwise appears to be degradation.
Predictive maintenance also depends on time synchronization. If current, vibration and control events use inconsistent clocks, root-cause analysis can reverse the sequence of events.
Rules, anomaly detection and supervised models
Rules are transparent and effective when engineering limits are known. They struggle with interacting variables and equipment whose healthy operating envelope changes across products or loads.
Unsupervised anomaly detection learns normal behavior and flags deviation without requiring many failure examples. It can detect novelty, but an anomaly is not automatically a fault.
Supervised classification maps signals to labeled failure modes. It needs representative examples of each class, which are scarce because catastrophic failures are uncommon and maintenance records are often inconsistent.
Remaining-useful-life regression attempts to estimate time or cycles before a defined failure threshold. Its error must be evaluated against the planning window; a mathematically good estimate can still be operationally useless if the uncertainty exceeds parts lead time.
Hybrid predictive maintenance combines engineering rules, anomaly models and human diagnosis. This often provides better explainability and field acceptance than a single opaque score.
Why failure labels are the hardest data asset
A work order may say “motor replaced” without recording whether the cause was a bearing, insulation, alignment, cooling or process overload. That label is too broad for reliable supervised learning.
Failure coding must distinguish symptom, component, mechanism, cause and corrective action. Technicians need a short, usable form rather than a taxonomy so complex that they select “other.”
Predictive maintenance teams should audit label consistency before training. Historical volume is not useful when the meaning of the records changes across shifts, sites or contractors.
Digital twins and physics-informed models
A digital twin can compare measured behavior with a physical or statistical representation of the asset. The term covers many fidelity levels, from a simple expected-performance curve to a detailed simulation.
Physics-informed models are valuable when failure data are sparse but governing relationships are understood. They still require calibration, boundary conditions and validation against real operating data.
The twin should answer a defined decision question. A visually impressive 3D model that does not improve lead time, diagnosis or maintenance planning is presentation software rather than reliability infrastructure.
Performance Evaluation Matrix
The matrix below separates model quality from maintenance value. Thresholds must be set per asset family before the pilot results are known.
| Dimension | Metric | Calculation | Decision relevance |
|---|---|---|---|
| Detection | Recall | Detected relevant events / actual relevant events | Quantifies missed-failure exposure |
| Alert quality | Precision | Confirmed actionable alerts / all alerts with a completed outcome assessment; report unresolved alerts separately. | Quantifies wasted inspection effort |
| Balanced quality | F1 score | Harmonic mean of precision and recall | Useful when both error types matter |
| Warning | Median lead time | Detection time to confirmed intervention need | Must exceed planning and parts lead time |
| Prognosis | RUL error | Difference between predicted and observed remaining life | Tests scheduling usefulness |
| Reliability | False alarms per asset-month | False alerts / monitored asset-months | Predicts technician alert fatigue |
| Operations | Alert-to-inspection time | Inspection timestamp minus alert timestamp | Measures response process |
| Economics | Cost per confirmed finding | Total program cost / confirmed actionable findings | Compares architecture and vendor value |
| Availability | Avoided downtime | Baseline-adjusted hours plausibly prevented | Links the system to production impact |
| Data | Sensor completeness | Valid expected samples / expected samples | Detects pipeline and hardware gaps |
| Drift | Override trend | Technician rejections by model version and month | Signals declining trust or model fit |
| Safety | Unsafe automated actions | Confirmed unauthorized actions | Must remain zero |
Define warning lead time as the interval between the first qualifying alert and a documented intervention deadline or observed failure. When maintenance prevents the failure, record how the intervention deadline was established; the original failure time cannot be directly observed. Report the proportion of warnings that provide enough time to act, alongside median lead time.
A predictive maintenance alert should count as successful only when it is timely, specific and actionable. Finding a failure after the maintenance window has closed adds little operational value.
Field-validation design
Begin predictive maintenance in shadow mode. Generate alerts without automatically creating production work, then have reliability engineers compare them with inspections and existing monitoring.
Use an event-based split for evaluation. Randomly mixing samples from the same failure event across training and test data creates leakage and inflated accuracy.
Predictive maintenance pilots need healthy periods, known faults, process transients and maintenance interventions. A test set containing only clean faults does not represent live operations.
Track censored cases. An asset that has not yet failed is not proof that a warning was false, especially when the observation window ends early.
Research Datasets and Condition-Monitoring Standards
NASA’s C-MAPSS turbofan simulation data remain widely used for prognostics research because they provide run-to-failure trajectories under defined operating conditions.[1] A simulated engine benchmark does not establish performance on a buyer’s pumps or robots.
The Case Western Reserve University bearing dataset provides documented motor-bearing vibration data under seeded faults.[2] It is valuable for method development but differs from naturally developing field damage.
The XJTU-SY dataset contains accelerated life-test bearing data under multiple operating conditions.[3] Buyers should use such datasets to understand methods, then validate on their own asset population.
ISO 17359 provides general guidance for setting up machine condition-monitoring programs, while ISO 13374 addresses data-processing and information-presentation architecture.[4][5] Standards guide process design; they do not certify a particular model’s prediction accuracy.
Deployment Challenges
Sensor installation and survivability
Mounting stiffness, location and orientation can change the measured vibration. Wireless sensors add battery life, radio coverage and hazardous-area certification concerns.
Predictive maintenance budgets must include installation, calibration, replacement and periodic verification. A cheap sensor becomes expensive when access requires a shutdown, lift or specialist permit.
Asset hierarchy and tag governance
Analytics, historians and CMMS platforms often use different names for the same equipment. Mergers, line modifications and temporary repairs make the mapping worse.
Create a stable asset identifier and govern tag changes. Model results must remain traceable to the physical component and maintenance record after systems are upgraded.
Sparse failures and changing conditions
Critical machines may operate for years without a labeled failure. New recipes, speeds or control logic can change normal behavior before enough fault data accumulate.
Use rules and anomaly detection where labels are sparse, and update operating-state models deliberately. Predictive maintenance should expose uncertainty rather than manufacture a precise failure probability.
False alarms and alert fatigue
Every false alert consumes technician time and damages confidence. Once the team begins ignoring notifications, even correct warnings lose value.
Tune thresholds against the cost of investigation and missed failure. Escalation tiers can request a remote review before a work order or shutdown is created.
CMMS workflow friction
Creating work orders automatically can flood the backlog with low-quality tasks. Maintenance planning requires job scope, parts, skills, safety permits, access and an achievable window.
Predictive maintenance integration should begin with a recommendation or inspection request. Automation can increase only after the alert-to-finding conversion rate is stable.
Cybersecurity and operational technology boundaries
Sensors and gateways expand the attack surface. Default credentials, outdated firmware, flat networks and unnecessary inbound access can create paths toward operational technology.
Use network segmentation, asset inventory, signed updates, least privilege, certificate-based identity and monitored outbound connections. Analytics should not receive authority to stop equipment unless a separately engineered safety and control design requires it.
Model lifecycle cost
Models need monitoring, retraining, versioning and rollback. The cost continues after the pilot and may exceed the original data-science effort.
Predictive maintenance software contracts should specify model change notices, data export, service levels and exit support. A plant should remain able to maintain assets if the analytics service is unavailable.
III. Commercial Solutions and Best Practices
Feature and Cost Comparison Table
These predictive maintenance platforms address overlapping but different scopes. Public pricing is incomplete for enterprise deployments, so the cost column identifies the commercial structure rather than inventing a comparable list price.
| Solution | Best fit | Architecture strengths | Commercial model | Principal buying question |
|---|---|---|---|---|
| IBM Maximo Application Suite | Organizations consolidating EAM, inspection and health workflows | Asset hierarchy, work management, monitoring, mobile and enterprise integration | AppPoints/subscription and implementation; quote based | Can health alerts connect cleanly to existing Maximo work and failure records? |
| Siemens Senseye Predictive Maintenance | Industrial fleets seeking scalable condition analytics | Automated condition monitoring, industrial domain focus and multi-asset deployment | Enterprise quote, connectivity and services | Which asset types, data connectors and diagnostic outputs are supported contractually? |
| GE Vernova Asset Performance Management | Asset-intensive energy and industrial operations | Reliability strategy, asset health and risk-centered planning | Enterprise subscription and implementation quote | Does deployment require the broader APM stack and what is the migration effort? |
| Azure IoT Operations plus partner analytics | Teams building a composable edge-to-cloud stack | Edge data services, cloud integration and flexible model hosting | Consumption, infrastructure, partner licenses and engineering | Is the organization prepared to own model lifecycle and systems integration? |
This is not an accuracy ranking. Predictive maintenance performance depends on assets, sensors, failure modes, data history and workflow adoption more than the brand name.
Build, buy or combine
A packaged predictive maintenance platform reduces time spent building asset screens, alert workflows and connectors. It may constrain model choice and create licensing costs across every monitored asset.
A custom system offers control over features, models and deployment location. The organization assumes responsibility for data engineering, MLOps, cybersecurity, user interfaces and 24-hour support.
A hybrid design can use a commercial asset performance management layer with internally governed models for proprietary equipment. Contract terms should preserve access to raw and derived data.
Seven-gate implementation framework
Gate 1: Rank assets by consequence
Score safety, environment, quality, throughput, repair cost, redundancy and parts lead time. Select an asset family where early warning can change a real decision.
Gate 2: Define failure modes
Use maintenance history, FMEA, engineering review and technician interviews. Do not begin with “collect all available data.”
Gate 3: Specify the sensing plan
Map each failure mode to a measurable signal, sampling requirement, mounting method and expected warning interval. Record installation photos and sensor orientation.
Gate 4: Establish the baseline
Measure unplanned downtime, failure frequency, preventive work, inspection effort, scrap and event cost. Predictive maintenance ROI cannot be calculated without a credible counterfactual.
Gate 5: Validate in shadow mode
Operate alongside existing maintenance and document every alert outcome. Freeze thresholds for a defined period so teams cannot tune away inconvenient errors after the fact.
Gate 6: Integrate controlled action
Begin with inspection requests, not automatic part replacement. Require approval when production, safety or significant cost is affected.
Gate 7: Scale by proven asset family
Expand only after field precision, lead time, response time and cost per confirmed finding meet the agreed gates. Retrain or redesign when conditions differ materially.
Cost-optimization practices
Instrument critical failure modes rather than every available point. Reuse trustworthy PLC and historian data when sampling and quality are sufficient.
Process high-frequency signals at the edge and retain triggered raw windows for investigation. Set retention by diagnostic value instead of storing every waveform indefinitely.
Route simple threshold cases through rules and reserve machine learning for interactions that rules cannot handle. Predictive maintenance cost optimization should reduce waste without hiding evidence from reliability engineers.
Negotiate pricing around asset counts, data volume, modules, sites and support. Include sensor replacement, integration, training, cybersecurity and model maintenance in total cost of ownership.
IV. Business Outcomes and Strategic ROI Takeaways
Outcomes worth measuring
The primary predictive maintenance outcomes are avoided unplanned downtime, fewer emergency interventions, reduced secondary damage and better planned-work execution. Parts savings matter only when reliability is not sacrificed.
Predictive maintenance can improve spare-parts planning by extending the warning interval. It can also increase inventory if teams stock every component mentioned in low-confidence alerts.
Safety benefits must be connected to identified failure hazards and verified controls. A condition model is not a substitute for machine guarding, protective trips, inspections or legally required preventive maintenance.
Transparent ROI model
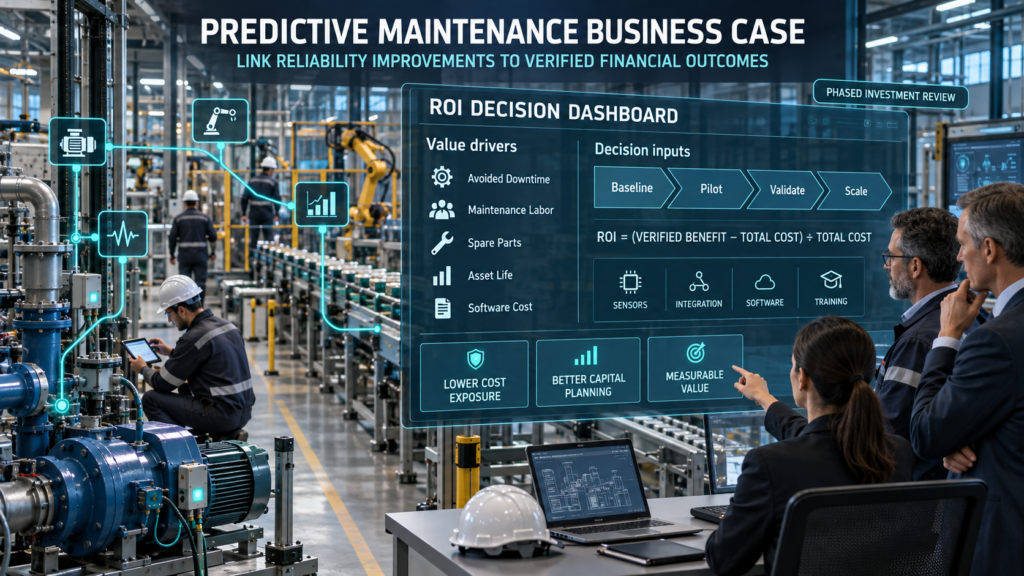
Calculate annual net benefit as avoided event cost plus verified labor and parts savings minus sensing, integration, software, cloud, review and lifecycle costs. Use observed pilot performance rather than vendor averages.
Assume a production line experiences eight relevant unplanned events annually. Each event causes four hours of constrained downtime at a contribution loss of $12,000 per hour plus $8,000 in repair, scrap and expedited costs.
The illustrative baseline annual exposure is $448,000: eight events × [(four downtime hours × $12,000 per hour) + $8,000 in repair, scrap and expedited costs]. Replace these assumptions with verified plant finance data.
If a validated pilot would detect five of those events early enough to avoid three downtime hours and $4,000 of secondary cost per event, gross annual benefit is $200,000. The model receives no credit for alerts that arrive too late or are not acted upon.
Assume annualized hardware, installation, software, engineering, cybersecurity and operating costs total $125,000. Against the illustrative $200,000 annual benefit, annual net benefit is $75,000 and ROI on the annualized cost basis is 60%: ($200,000 − $125,000) / $125,000. This is not a first-year cash-flow calculation; assess upfront investment and recurring expenditure separately.
Run downside, expected and upside cases. Predictive maintenance economics are sensitive to event frequency, warning lead time, intervention effectiveness and the actual constrained-hour value.
Executive outcome scorecard
| Outcome | Baseline | Pilot result | Scale gate |
|---|---|---|---|
| Relevant unplanned events | Historical annual rate | Events during observation | Reduction with comparable production conditions |
| Field precision | No model | Confirmed actionable alerts / alerts with completed outcome assessments | Asset-specific target |
| Event recall | Existing monitoring | Timely detections / relevant events | Based on consequence tolerance |
| Median warning lead time | Existing warning | Alert to confirmed intervention need | Exceeds planning requirement |
| False alerts | Existing alarms | False alerts per asset-month | Within technician capacity |
| Cost per confirmed finding | Current inspection cost | Total pilot cost / findings | Below approved value threshold |
| CMMS response | Current process | Alert-to-inspection time | Within defined service level |
| Safety incidents from automation | Current baseline | Confirmed events | Zero |
The predictive maintenance scorecard should be approved before the trial. Changing the success definition after seeing data produces a sales narrative, not evidence.
When not to scale
Do not scale when failure labels remain inconsistent, sensors frequently disconnect or operating-state changes dominate the alert score. More assets will amplify the same defects.
Pause when technicians cannot investigate alerts within the useful lead time. Stop when the system encourages unsafe intervention, bypasses required maintenance or cannot be isolated from the control network.
Predictive maintenance deserves production status only when the organization can explain what is sensed, what is inferred, what action follows and how the result is verified.
V. Risk Mitigation and Regulatory Framework
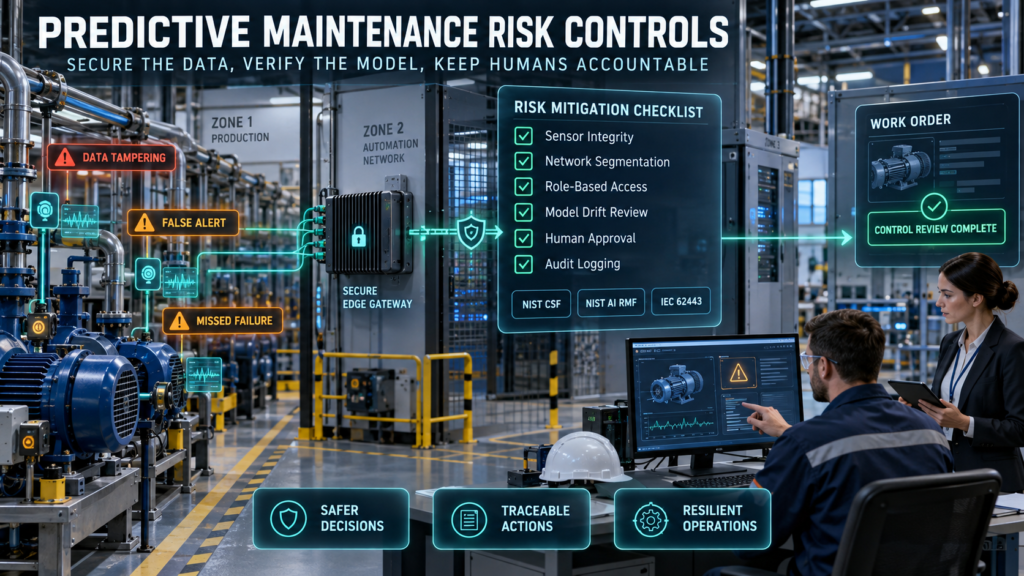
NIST AI RMF checklist
NIST’s AI Risk Management Framework organizes controls around Govern, Map, Measure and Manage. Apply those functions when machine-learning outputs influence maintenance priority or operational action.
- Govern: Assign accountable reliability, operations, cybersecurity and model owners.
- Map: Document assets, users, affected workers, data, failure consequences and operating limits.
- Measure: Test accuracy, uncertainty, drift, security, latency, fairness where relevant and human factors.
- Manage: Prioritize mitigations, accept residual risk explicitly and maintain stop criteria.
- Version models, thresholds, feature code and training datasets.
- Preserve alert, review, work-order and technician-finding records.
- Test rollback and manual maintenance procedures.
IEC 62443 and OT cybersecurity checklist
Industrial analytics cross information-technology and operational-technology boundaries. IEC 62443’s zones-and-conduits concept supports segmentation according to risk and required communication.
- Inventory sensors, gateways, firmware, certificates and network paths.
- Place analytics devices in defined security zones with minimal conduits.
- Deny unsolicited inbound cloud connections to control networks.
- Replace default credentials and use unique device identities.
- Validate signed firmware and maintain supported patch procedures.
- Monitor configuration, data quality and unexpected outbound traffic.
- Keep safety functions independent from non-safety analytics unless formally engineered.
EU AI Act checklist
Using AI for equipment health does not automatically create a high-risk system. Classification depends on intended purpose, deployment context and whether the system becomes a safety component or affects regulated decisions.
- Identify the organization’s role as provider, deployer, importer or distributor.
- Determine whether the model is a safety component of a regulated product or system.
- Document intended purpose, foreseeable misuse and human oversight.
- Maintain required risk management, data governance, logging and technical documentation.
- Reassess classification after an integration or purpose change.
- Obtain legal review before using analytics to control safety-critical equipment automatically.
Safety and workforce checklist
- Preserve lockout/tagout and permit-to-work procedures regardless of model output.
- Require qualified inspection before intrusive maintenance.
- Design alerts to show evidence, uncertainty and recommended verification.
- Train technicians on false positives, false negatives and escalation.
- Monitor automation bias and alert fatigue.
- Prohibit performance scoring of workers unless separately justified, disclosed and reviewed.
Residual limitations
Predictive maintenance cannot detect failures that produce no measurable precursor in the installed sensors. Sudden external damage, hidden defects and novel operating conditions can defeat a well-performing historical model.
The system may also shift risk rather than remove it. Deferring a preventive task based on an uncertain model can increase exposure if the equipment has an age-driven or legally mandated failure mechanism.
Human expertise remains essential. A model can prioritize evidence, but technicians and engineers must connect that evidence to physical condition, safe work and production reality.
Planning a Reliability Pilot
Select one critical asset family and two or three failure modes with measurable precursors. Approve a 90-day shadow phase only after sensor installation, asset mapping, cybersecurity review and evaluation thresholds are documented.
At the decision gate, choose to stop, extend observation or integrate controlled inspection requests. Scale predictive maintenance only when timely field findings and risk-adjusted savings exceed the full lifecycle cost.
Frequently Asked Questions
What is the difference between predictive and preventive maintenance?
Preventive work follows time, usage or mandated intervals. Predictive maintenance uses measured condition and analytics to estimate risk or remaining life before choosing an intervention.
Does every machine need AI?
No. Thresholds and engineering rules can be more transparent and economical for stable failure modes, while low-criticality components may be suitable for run-to-failure.
Which sensors should a plant install first?
Start from the failure mode. Vibration, temperature, current, pressure, acoustics and oil condition answer different diagnostic questions and require different sampling and mounting.
How much historical data is required?
There is no universal duration. The required data depends on operating cycles, failure frequency, model type and whether labels exist; shadow-mode evidence is usually more valuable than an arbitrary month count.
Can the software create work orders automatically?
It can, but early deployments should create inspection recommendations first. Automatic work orders are appropriate only after alert quality and planning data remain stable.
How should ROI be measured?
Credit only events detected with enough lead time to support an effective intervention. Subtract hardware, installation, integration, software, cloud, review, cybersecurity and model-lifecycle costs.
Appendix and Research Integrity
Sources and Citations Index
- NASA Prognostics Center of Excellence, C-MAPSS Turbofan Engine Degradation Simulation Data Set: NASA Open Data.
- Case Western Reserve University Bearing Data Center, Seeded fault bearing datasets: CWRU Bearing Data Center.
- Wang et al., A New Run-to-Failure Dataset for Rolling Element Bearings under Various Operating Conditions: XJTU-SY dataset paper.
- International Organization for Standardization, ISO 17359: Condition monitoring and diagnostics of machines — General guidelines: ISO 17359.
- International Organization for Standardization, ISO 13374-1: Condition monitoring and diagnostics of machines — Data processing, communication and presentation: ISO 13374-1.
- NIST, Artificial Intelligence Risk Management Framework: NIST AI RMF.
- NIST, Guide to Operational Technology Security, SP 800-82 Rev. 3: NIST SP 800-82r3.
- ISA, ISA/IEC 62443 Series of Standards: ISA industrial cybersecurity standards.
- European Union, Regulation (EU) 2024/1689 — Artificial Intelligence Act: EUR-Lex official text.
- IBM, Maximo Application Suite: Official IBM product page.
- Siemens, Senseye Predictive Maintenance: Official Siemens product page.
- GE Vernova, Asset Performance Management: Official GE Vernova software page.
- Microsoft, Azure IoT Operations documentation: Microsoft Learn.
Evidence limitations
Laboratory and simulation datasets simplify conditions and may contain seeded or accelerated faults. Their results do not establish field performance on another asset, load profile or sensor installation.
Vendor features, names, licensing and service terms can change. Buyers should verify current commercial documentation and execute a dataset-specific proof of value before purchase.
Corporate Editorial Transparency and AI Usage Disclosure
AI-assisted tools were used to support research organization, drafting and language refinement. NezzHub retains editorial responsibility for the published article. Vendor inclusion does not constitute endorsement.
Author and Editorial Review
Author: Garikapati Bullivenkaiah
Technology research writer with LL.B., LL.M., M.A., and MBA qualifications. He writes about emerging technologies and their business, governance and legal implications. His multidisciplinary academic background informs his analysis of technology adoption, intellectual property, and organizational risk. His articles explain technical concepts and practical considerations for business owners, IT managers and technology decision-makers. LinkedIn Profile
Reviewed by: Chitikineni Ramadevi — Editor
Chitikineni Ramadevi holds an M.Sc. in Computers from Andhra University and has over 10 years of research experience in technology-related subjects. She reviews NezzHub articles for clarity, factual accuracy, source support and practical relevance.
Published by: NezzHub
Research approach: This article draws on primary sources, technical documentation and relevant industry research. References are provided within the article or its sources section.
Last reviewed: 09-13-2026
Corrections: To report a factual error or outdated information, please contact NezzHub.

Garikapati Bullivenkaiah is a seasoned entrepreneur with a rich multidisciplinary academic foundation—including LL.B., LL.M., M.A., and M.B.A. degrees—that uniquely blend legal insight, managerial acumen, and sociocultural understanding. Driven by vision and integrity, he leads his own enterprise with a strategic mindset informed by rigorous legal training and advanced business education. His strong analytical skills, honed through legal and management disciplines, empower him to navigate complex challenges, mitigate risks, and foster growth in diverse sectors. Committed to delivering value, Garikapati’s entrepreneurial journey is characterized by innovative approaches, ethical leadership, and the ability to convert cross-domain knowledge into practical, client-focused solutions.